Cash Conversion Cycle Benchmarks by Industry
Why your cash conversion cycle looks nothing like the benchmark.
Cash conversion cycle benchmarks swing wildly by industry, and if you're a B2B finance team wondering why your CCC looks nothing like the case study you read last week, the answer is almost always DSO. DIO and DPO matter, sure, but DSO, the time it takes customers to actually pay you, is the lever most companies can pull without blowing up their supply chain or their supplier relationships.
Quick refresher, because the formula gets thrown around a lot without context: CCC = DIO + DSO − DPO. It's the gap between when you pay for inputs and when you collect cash from customers. A positive CCC means you're funding that gap yourself, while a negative one means your suppliers are, whether they realize it or not.
Three levers, three different jobs. DIO is how long inventory sits before it turns into revenue. DSO is how long customers take to pay once you've made the sale. DPO is how long you take to pay your own suppliers. A grocery chain has almost no receivables and inventory that spoils if it sits too long, so its CCC is structurally short. A luxury goods maker runs long production cycles and gives B2B buyers generous terms, so its CCC is structurally long. Comparing the two is like comparing a sprinter's mile time to a marathoner's and asking who's the better runner. The only comparison that means anything is peer against peer, inside the same business model.
Where most companies stand today: the macro working capital picture
Two big surveys, two slightly different company sets, same basic story. The Hackett Group's 2025 U.S. Working Capital Survey, which covers the top 1,000 U.S. public nonfinancial companies, found CCC improved to roughly 37 days in 2024, down from about 38 in 2023. That's a 4% gain. Deloitte's 2025 Working Capital Roundup, looking at more than 2,300 companies, found a similar direction but smaller magnitude: CCC shortened by under a day year-over-year, mostly from inventory cuts and stretched-out payables.
Here's the part that doesn't make the headline: DPO did the heavy lifting. Companies got better at delaying their own payments, while DSO actually got worse, for the second year running, according to Hackett. So the aggregate number improved while the collections side of the business quietly slipped.
And the gap between winners and everyone else is growing. Upper-quartile companies are pulling further ahead, while median companies are treading water. This is a widening gap between the boats that fixed their leaks and the ones that didn't bother.
Europe is telling the opposite story. Hackett's 2025 European survey found CCC worsened by about 3% in 2024, driven by climbing DSO and inventory buildup, even though DPO improved over there too. If you run a multinational, that divergence alone should make you wary of applying a single global benchmark to every region.
None of this tells you much on its own, though. The real signal lives one level down, in the sector data.
Industries with structurally short CCCs: grocery, FMCG, and consumer staples retail
Grocery and FMCG are the textbook low-CCC businesses. Inventory turns fast because it has to (nobody wants three-week-old lettuce), customers pay at the register, and receivables are practically nonexistent.
This is how a company like Walmart or Costco pulls off a negative CCC: sell the inventory in days, pay suppliers weeks later. It's scale plus leverage, and it produces a genuine structural cash advantage. Amazon takes this to the extreme, collecting payment instantly while stretching supplier payment terms out much further, which is a big part of how it funds growth without leaning as hard on outside capital. Worth flagging though: that kind of negative CCC requires supplier leverage most companies simply don't have. Try to replicate it at a smaller scale and you'll just annoy your vendors into finding a new customer.
Hackett clocked a 119% CCC improvement in food and staples retail in 2024, one of the strongest sector gains of the year. That's largely supply chains finally settling back into pre-pandemic rhythm.
So if you're running a consumer staples business and your CCC looks bloated compared to peers, don't blame the industry. The structure is on your side here. Something operational is going on, and it's worth digging into before you assume this is just how the business works.
Industries with structurally long CCCs: manufacturing, pharmaceuticals, apparel, and luxury goods
Manufacturing is the opposite end of the spectrum. Raw materials, work-in-process, finished goods, all of it stretches out DIO. Then B2B payment terms pile DSO on top. DPO can soften the blow but rarely covers the whole gap. Allianz Trade's benchmarks put manufacturing DIO in a wide range, generally well above what retail sees.
For a concrete anchor: U.S. Steel posted a CCC of 26 days in FY2024 (DSO at 40, DIO at 58, DPO at 72), up from 19 days the year before. That's a real jump within a single fiscal year, for a company that's about as sophisticated as manufacturers get. It's a good reminder that even the pros see their CCC move around.
Pharma has its own version of this problem. Production takes time, quality testing takes time, regulatory holds take time, distribution takes time. On top of that, institutional buyers like hospitals and group purchasing organizations run their own payment clocks, pushing DSO up further. The encouraging part: pharma companies meaningfully reduced DSO in 2024, helped by stronger demand and factoring programs. Structurally long doesn't mean permanently stuck.
Luxury goods and specialty manufacturing are a different case entirely. Long production cycles there are a feature, not a bug, since nobody wants their handbag stitched together in an afternoon. CCCs north of 90 days are normal and appropriate in this category.
Apparel and footwear sit in similar territory, inventory-heavy by nature, though sector DSO improved a bit in 2024 thanks to more full-price selling and sharper demand forecasting. The thing worth remembering across all of these: because the receivables base is so large, even a small DSO improvement frees up a real amount of cash. Shaving a few days off a nine-figure receivables balance is not a rounding error.
Technology sectors: why SaaS, semiconductors, and IT distributors don't belong in the same bucket
"Tech" is not one industry when it comes to working capital, and lumping it together is where a lot of benchmarking exercises go wrong.
SaaS sits at one extreme. Customers often pay upfront, there's no inventory to speak of, and deferred revenue works in the company's favor. Hackett found close to an 80% CCC improvement in internet software and services in 2024, partly riding the AI demand wave.
Semiconductors are doing the opposite thing on purpose. DSO climbed sharply in 2024, the steepest jump in more than a decade, as chipmakers extended payment terms to hyperscalers and AI infrastructure buyers in exchange for locking in long-term supply commitments. That's a strategic trade: longer receivables in exchange for guaranteed volume. Context is everything here; the same DSO number can mean "we're losing control of collections" in one company and "we just signed a five-year supply deal" in another.
IT distribution splits the difference. ePlus's technology segment ran a CCC of 29 days as of March 2025, with DSO at 66 days, DIO at 14, and DPO at 51. Fast inventory turns and stretched payables offset a DSO that would look alarming in a pure software business but is completely normal for a distributor.
Telecom tech gives you another data point. Calix reported a Q3 2025 CCC of 108 days, down from 127 a year earlier, with a stated internal target range of 100 to 130 days. That's a company managing to its own sector benchmark out loud, not chasing some universal number.
DSO in the 60s is excellent for a distributor and a five-alarm fire for a SaaS company. Same metric, opposite meaning, depending entirely on the business model underneath it.
eCommerce and DTC: where inventory strategy drives the CCC more than collections do
DTC brands and marketplace sellers look nothing alike on a CCC basis, mostly because of inventory. Own-brand DTC operators hold stock, while marketplace sellers frequently don't.
Inventory days are the real drag for DTC. Per Finaloop's benchmarks on DTC eCommerce profitability, the median DIO sits around 129 days, while top-quartile operators run closer to 42. That gap is basically a price tag on bad forecasting: it's the working capital cost of ordering too much, too early, on a hunch.
DSO, meanwhile, is naturally low for direct-to-consumer sales, since card payments settle in days. But plenty of DTC brands also run a wholesale channel, and those B2B accounts can drag the blended DSO up more than people expect.
The real risk in this category is stocking ahead of demand that never shows up. Inventory piles up in a warehouse, cash disappears into it, and suddenly DIO is running the whole CCC story. In DTC, the lever is inventory. In B2B, it's collections.
Why DSO is the most actionable component for most B2B businesses
DIO is largely locked in by supply chain design and product complexity. You can't change how long steel needs to cure or how long regulatory testing takes without rebuilding the operation. DPO is capped by supplier relationships and how much leverage you actually have; most mid-market companies can't just decide to pay suppliers later without straining those relationships or losing early-pay discounts.
DSO is different. It's governed by process, follow-up, and customer behavior, none of which require restructuring the business to change. Automation tools that chase overdue invoices across email, phone, and SMS sit squarely in this layer.
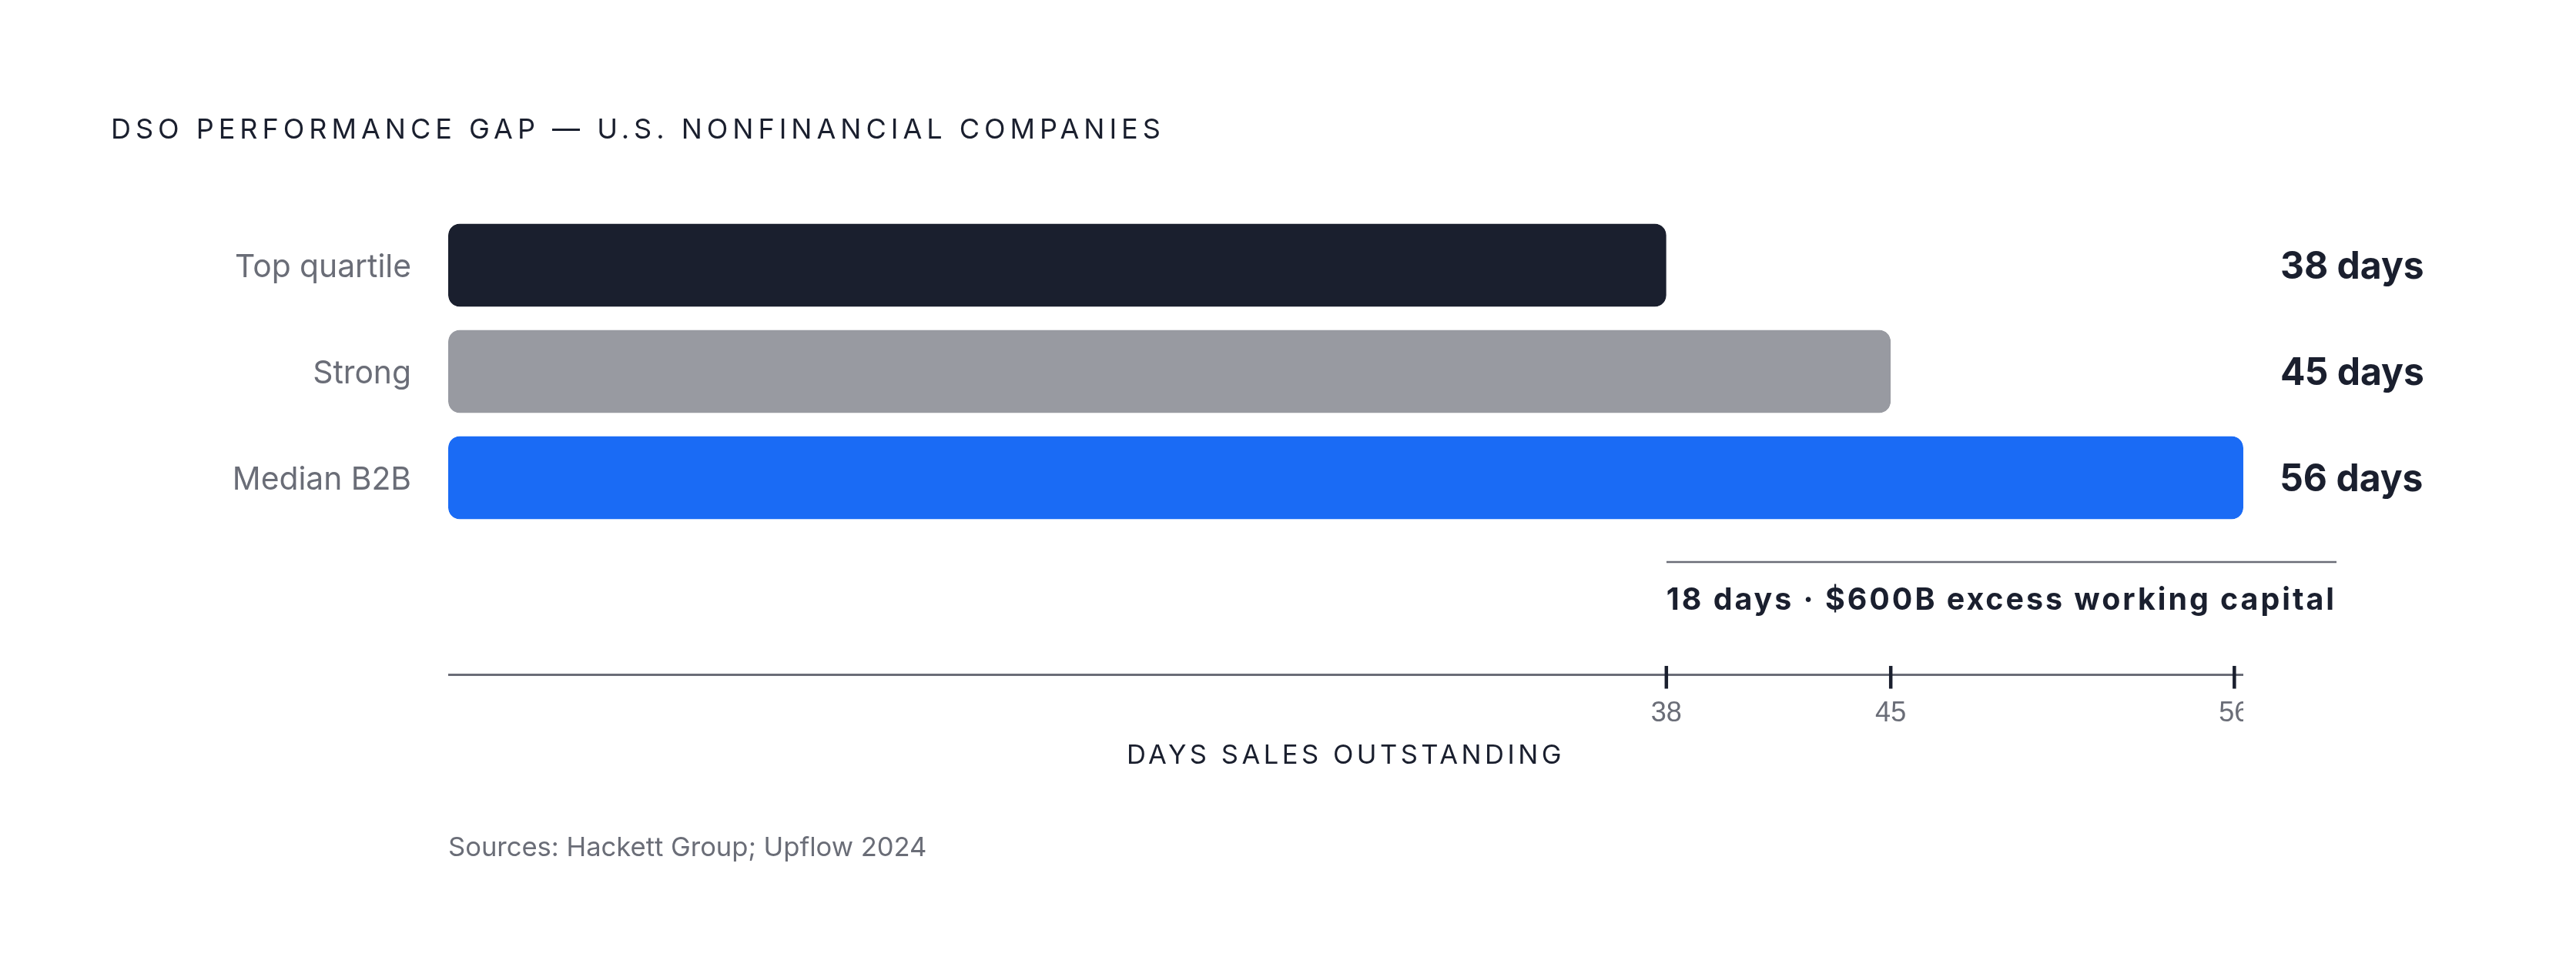
And the opportunity is not small. Hackett's research found accounts receivable now makes up the largest share of excess working capital among the top 1,000 U.S. nonfinancials, an opportunity valued at roughly $600 billion, driven by an 18-day DSO gap between top-quartile and median performers. That's the gap between a company that solved its collections process and one that hasn't gotten around to it yet.
The trend line makes this more urgent, not less. DSO has worsened for two straight years per Hackett, driven by customers gaining more bargaining power and pushing for longer terms. The gap widens every year a company doesn't actively manage it.
For context on where "good" sits: industry data puts the median DSO across B2B industries around 56 days, with anything under 45 generally considered strong. That 11-day spread between median and good is exactly where the working capital fight actually happens.
What drives DSO higher than peers even when payment terms look the same
Two companies can both write "net 30" on their invoices and land in completely different places on DSO. The terms on paper don't matter much if the invoice shows up late, lands in the wrong inbox, or gets disputed and sits there.
Most of the damage comes from things that never show up in a benchmark table:
- Invoices stuck in supplier portals like Coupa or Ariba, requiring manual submission and manual status checks just to confirm someone received it
- Missing paperwork, a W-9, a PO number, proof of delivery, that puts an invoice on hold before it's even entered the payment queue
- A customer with a question or a dispute who never hears back, so the invoice just quietly ages in place
- An invoice that needed someone to make a call weeks ago and never got escalated to the person who could
This is a persistence problem, which is exactly why staring at a benchmark spreadsheet won't fix it by itself. Healthcare is a good illustration: for life sciences and healthcare companies, the DSO drag usually isn't inventory at all, it's billing errors, denials, and collections rework. Fixing the AR process there is the single highest-leverage move on the table.
And it compounds, since every day an invoice sits unresolved is a day of cash you don't have. Across a large receivables book, a two-week delay in collections adds up to real money parked somewhere it shouldn't be.
How to use industry benchmarks to set a realistic DSO target and identify where the gap is
Start with the right peer group. Not "technology," but the actual subsector and business model, SaaS versus IT distribution versus hardware, the way the Calix and ePlus examples showed. Benchmarking against the wrong category will send you chasing a target that was never realistic for your business in the first place.
From there, calculate current DSO and break it apart. The aggregate number hides more than it reveals. What share of AR is current versus 30 to 60 days past due versus 60-plus? Is the problem spread across the whole book, or is it three big accounts dragging the average up?
Then check that number against the 18-day gap framework. If you're already in top-quartile range for your sector, the remaining opportunity is small and tactical. If you're at or below median, you're looking at something structural, and it's worth treating that way.
Last step: figure out why DSO is elevated. Is it intentional, like the semiconductor sector trading terms for supply commitments? Is it invoices failing to reach the right person, dispute volume, or nobody following up? These require completely different fixes, and mixing them up wastes time.
Common mistake worth naming: benchmarking CCC as one number without breaking it down. A company can have a mediocre CCC that's entirely a DIO problem, a supply chain issue, and mistake it for a collections failure, or the reverse. Decompose first, diagnose second.
Done right, this exercise gives you a realistic DSO target grounded in real peer data, a clear picture of where you're deviating from it, and a short list of what to fix first.
Closing the DSO gap: what separates top-quartile AR performance from median
That 18-day gap doesn't close because someone built a better dashboard. It closes because a team does the unglamorous work consistently: following up, clearing blockers, escalating when an invoice needs a human decision instead of letting it sit.
What top-quartile AR teams actually do differently, in practice:
- They confirm invoice receipt instead of sending it and hoping for the best
- Follow-up happens on a system, not because one person remembered to send an email before their coffee got cold
- Someone owns portal submissions and actually tracks status inside Coupa or Ariba instead of assuming the invoice landed
- Disputes get a response fast enough that the invoice doesn't quietly age past 60 days while everyone forgets it exists
None of this is glamorous work, and there's no benchmark spreadsheet that fixes it for you. It's the difference between a finance team that treats collections as an afterthought and one that treats it like the operational discipline it actually is. Eighteen days of working capital is sitting there for the taking, and somebody's collecting it. Might as well be you.