Working Capital Formula and Ratio Interpretation
A healthy working capital ratio depends on industry structure, not just the numbers themselves.

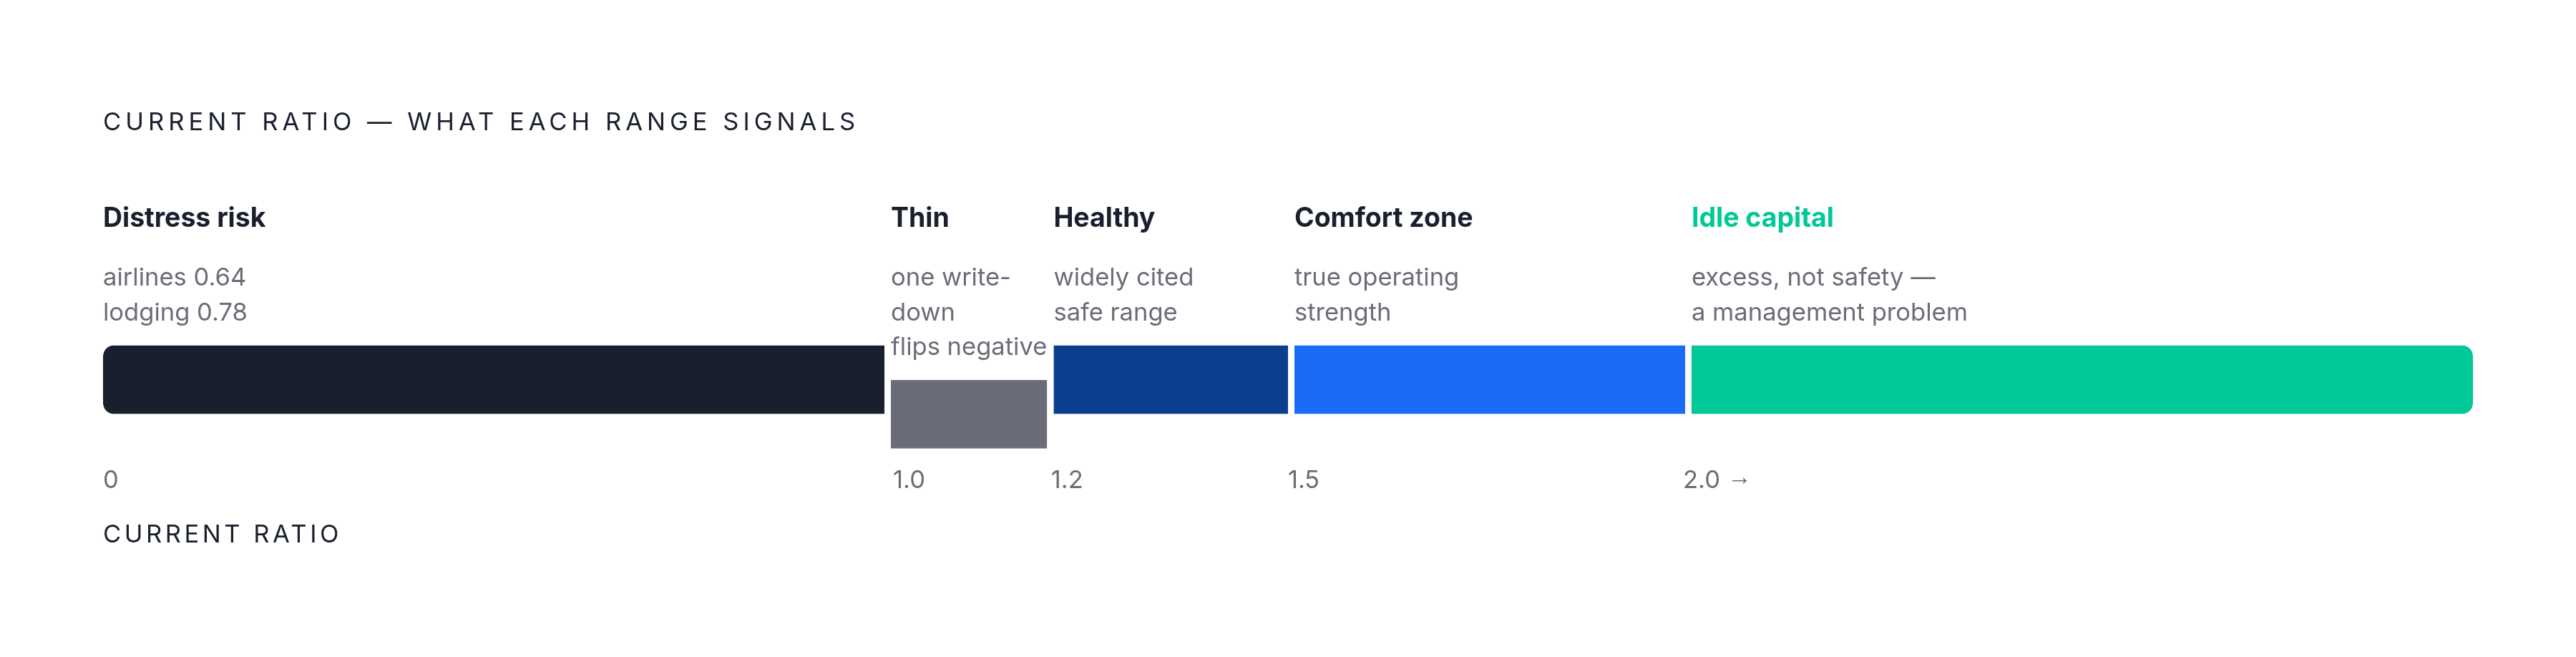
The widely cited healthy range is 1.2 to 2.0. Some analysts narrow that to 1.5 to 2.0 as the true comfort zone. Enough assets to cover liabilities, with room to absorb a hit, but not so much idle capital sitting around that you're wasting it.
Think of it like a life jacket: you want it snug enough to keep you afloat, but not so overstuffed that you can't move your arms.
So what do the zones actually look like in practice?
Below 1.0. Current liabilities exceed current assets. The company technically cannot cover short-term obligations from short-term resources alone. That can come from tough competitive conditions, poor cash management, or excessive bad debt. Staying below 1.0 is a path to serious trouble. Bankruptcy, in the worst cases. There's a real exception for certain high-volume retail and logistics models, but we'll get to that.
Between 1.0 and 1.2. Technically positive. Also thin. One delayed payment, one inventory write-down, and you flip negative fast.
Above 2.0. This is where people consistently get tripped up. A ratio above 2.0 is not automatically a good sign. It can mean excess idle capital with real opportunity cost. Money that could be going into R&D, production capacity, dividends, or buybacks. A high ratio is a management problem wearing a safety net as a costume. Capital sitting in a holding pattern is no strategy at all.
The most important thing to track is the trend, not any single reading. A ratio of 1.4 that has been declining for six straight quarters is far more alarming than a 1.6 that has been slowly, steadily climbing. One number in isolation tells you almost nothing about where the business is actually headed.
Why the Same Ratio Means Different Things in Different Industries
Comparing ratios across industries is not useful. You have to compare within sector. The variance is wide enough to make cross-industry comparisons actively misleading, and kind of irresponsible.
The actual data makes this obvious:
- Biotechnology: Average current ratio around 5.5. Not over-caution. A structural feature. Long development cycles, no product revenue for years, heavy regulatory costs. They hold cash because the business model requires it.
- Medical Devices: Around 4.05. Similar logic. Long receivable cycles, regulatory holding costs.
- Airlines: Around 0.64. One of the lowest measured. Also not a distress signal. A structural feature of how that business model operates.
- Lodging: Around 0.78. Same idea.
Why can low-ratio businesses be perfectly healthy? Think supermarkets or fast fashion. High inventory turnover. Cash at the point of sale. Minimal receivables because customers pay immediately. The cash cycle moves so fast that a low current ratio is structurally appropriate. When the operating model is generating cash every single day, a low current ratio does not equal liquidity risk.
The other direction is equally tricky. A biotech holding a 5.5 ratio is not doing so out of financial excellence. Necessity. And a manufacturer sitting at 4.0 with slow-moving inventory propping up current assets has a high ratio that's masking an operational problem, not reflecting strength.
Always establish the industry baseline before judging any ratio reading.
The Quick Ratio (When to Apply a Stricter Test)
The quick ratio: cash plus marketable securities plus accounts receivable, divided by current liabilities. You can also get there by subtracting inventory from current assets and dividing by current liabilities. Same result, two paths.
The logic is simple. Inventory does not always convert to cash quickly, or at full value, when you're under time pressure. The quick ratio strips inventory out entirely and focuses only on assets that can actually cover liabilities within days, not months.
Reach for the quick ratio when:
- Inventory is slow-moving, seasonal, or at risk of obsolescence
- The current ratio looks healthy but inventory is the biggest component of current assets
- You are evaluating a manufacturer, distributor, or retailer carrying significant stock
A company with a current ratio of 1.8 and a quick ratio of 0.9 is telling two very different stories. That gap is the thing worth digging into. What is actually in that inventory? How liquid is it? How fast can it move if it needs to?
The quick ratio does not replace the current ratio. It reveals what happens to liquidity if inventory cannot be moved on schedule. Both numbers together give you a more complete picture than either one alone.
What the Cash Conversion Cycle Shows That the Working Capital Ratio Cannot
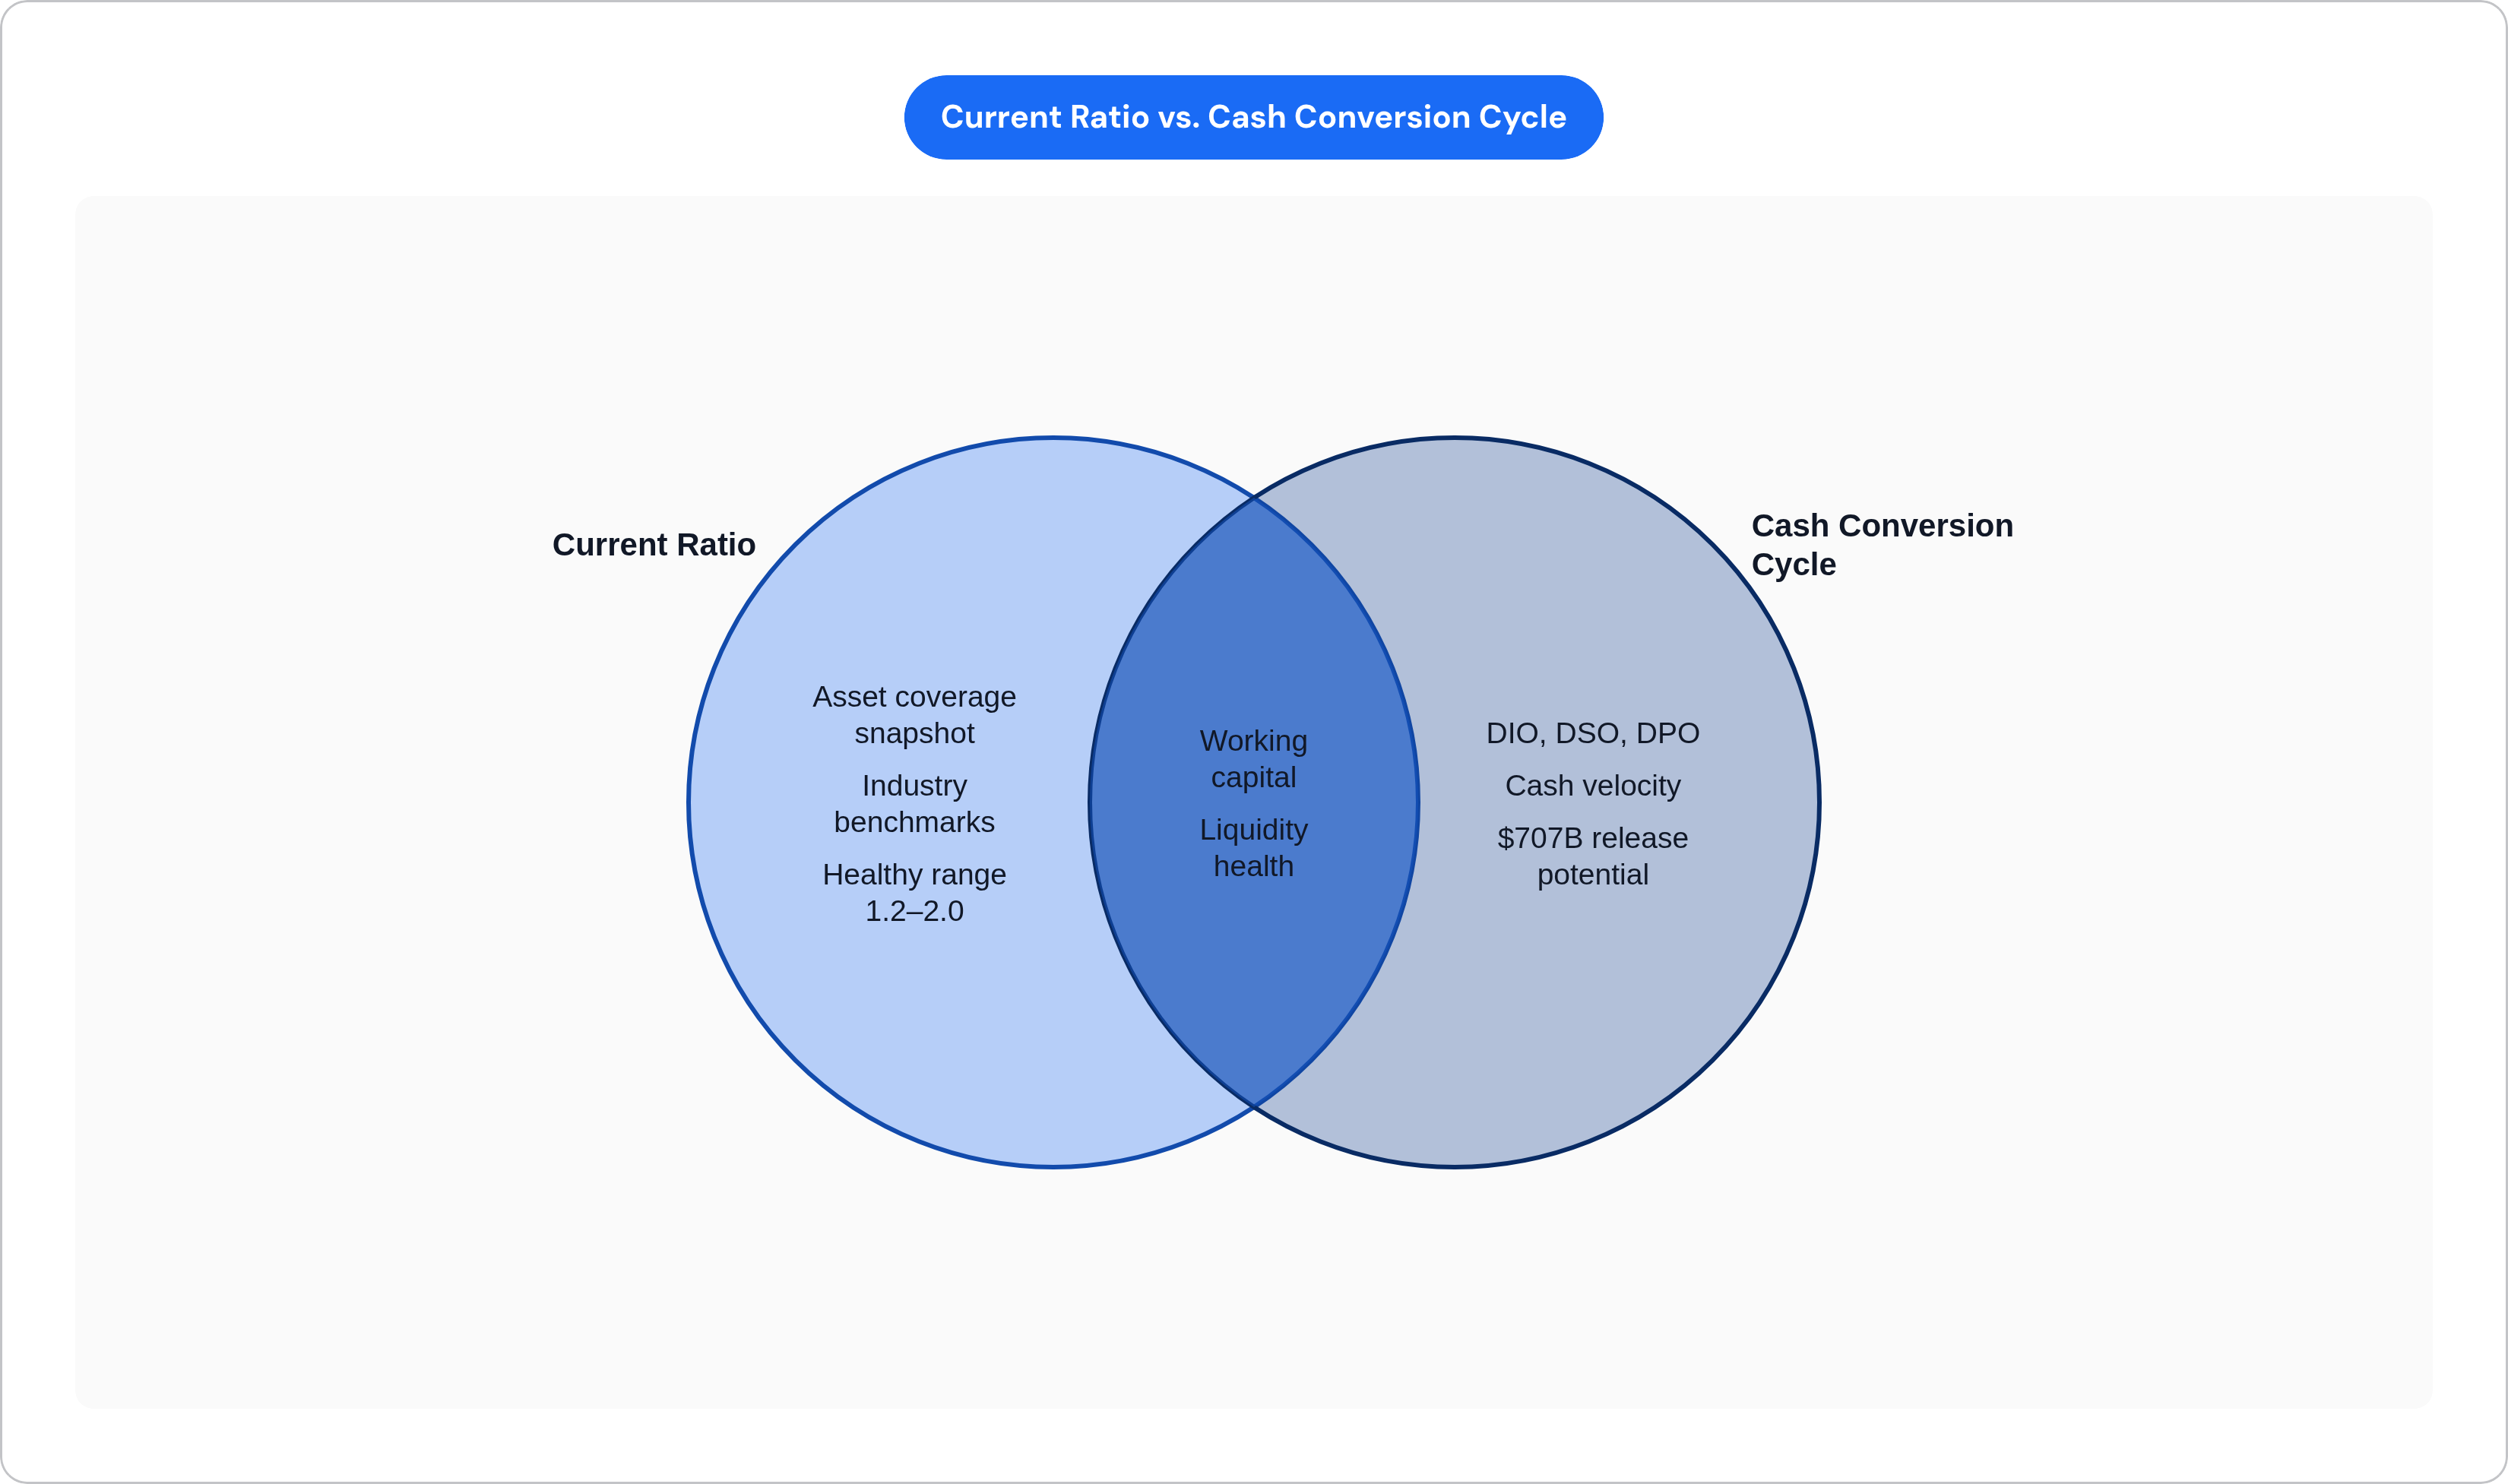
The working capital ratio tells you what you have. The cash conversion cycle tells you how fast it moves. That distinction matters more than most finance teams give it credit for.
A company can maintain a perfectly healthy ratio while suffering from slow cash conversion. High days sales outstanding, bloated inventory, extended collection timelines. None of that stress shows up in the ratio. It shows up in the CCC.
The formula: Days Inventory Outstanding (DIO) plus Days Sales Outstanding (DSO) minus Days Payable Outstanding (DPO).
- DIO: How long inventory sits before it sells
- DSO: How long it takes to collect payment after a sale
- DPO: How long the company takes to pay its own suppliers
The shorter the CCC, the faster cash returns to the business. A negative CCC means suppliers are effectively financing your operations, which is exactly where the most efficient businesses in the world have deliberately positioned themselves.
What does recent data actually show? KPMG analyzed thousands of U.S. public companies and found the aggregate CCC rose from 83 days in 2020 to 90 days in 2023, then improved marginally to 89 days in 2024. The primary driver: days inventory outstanding climbed from 73 to 80 days. Post-pandemic inventory accumulation that has been slow to unwind. DSO ended 2024 at 51 days. DPO held flat at 42 days. Companies were not meaningfully extending payment terms to compensate for the inventory drag.
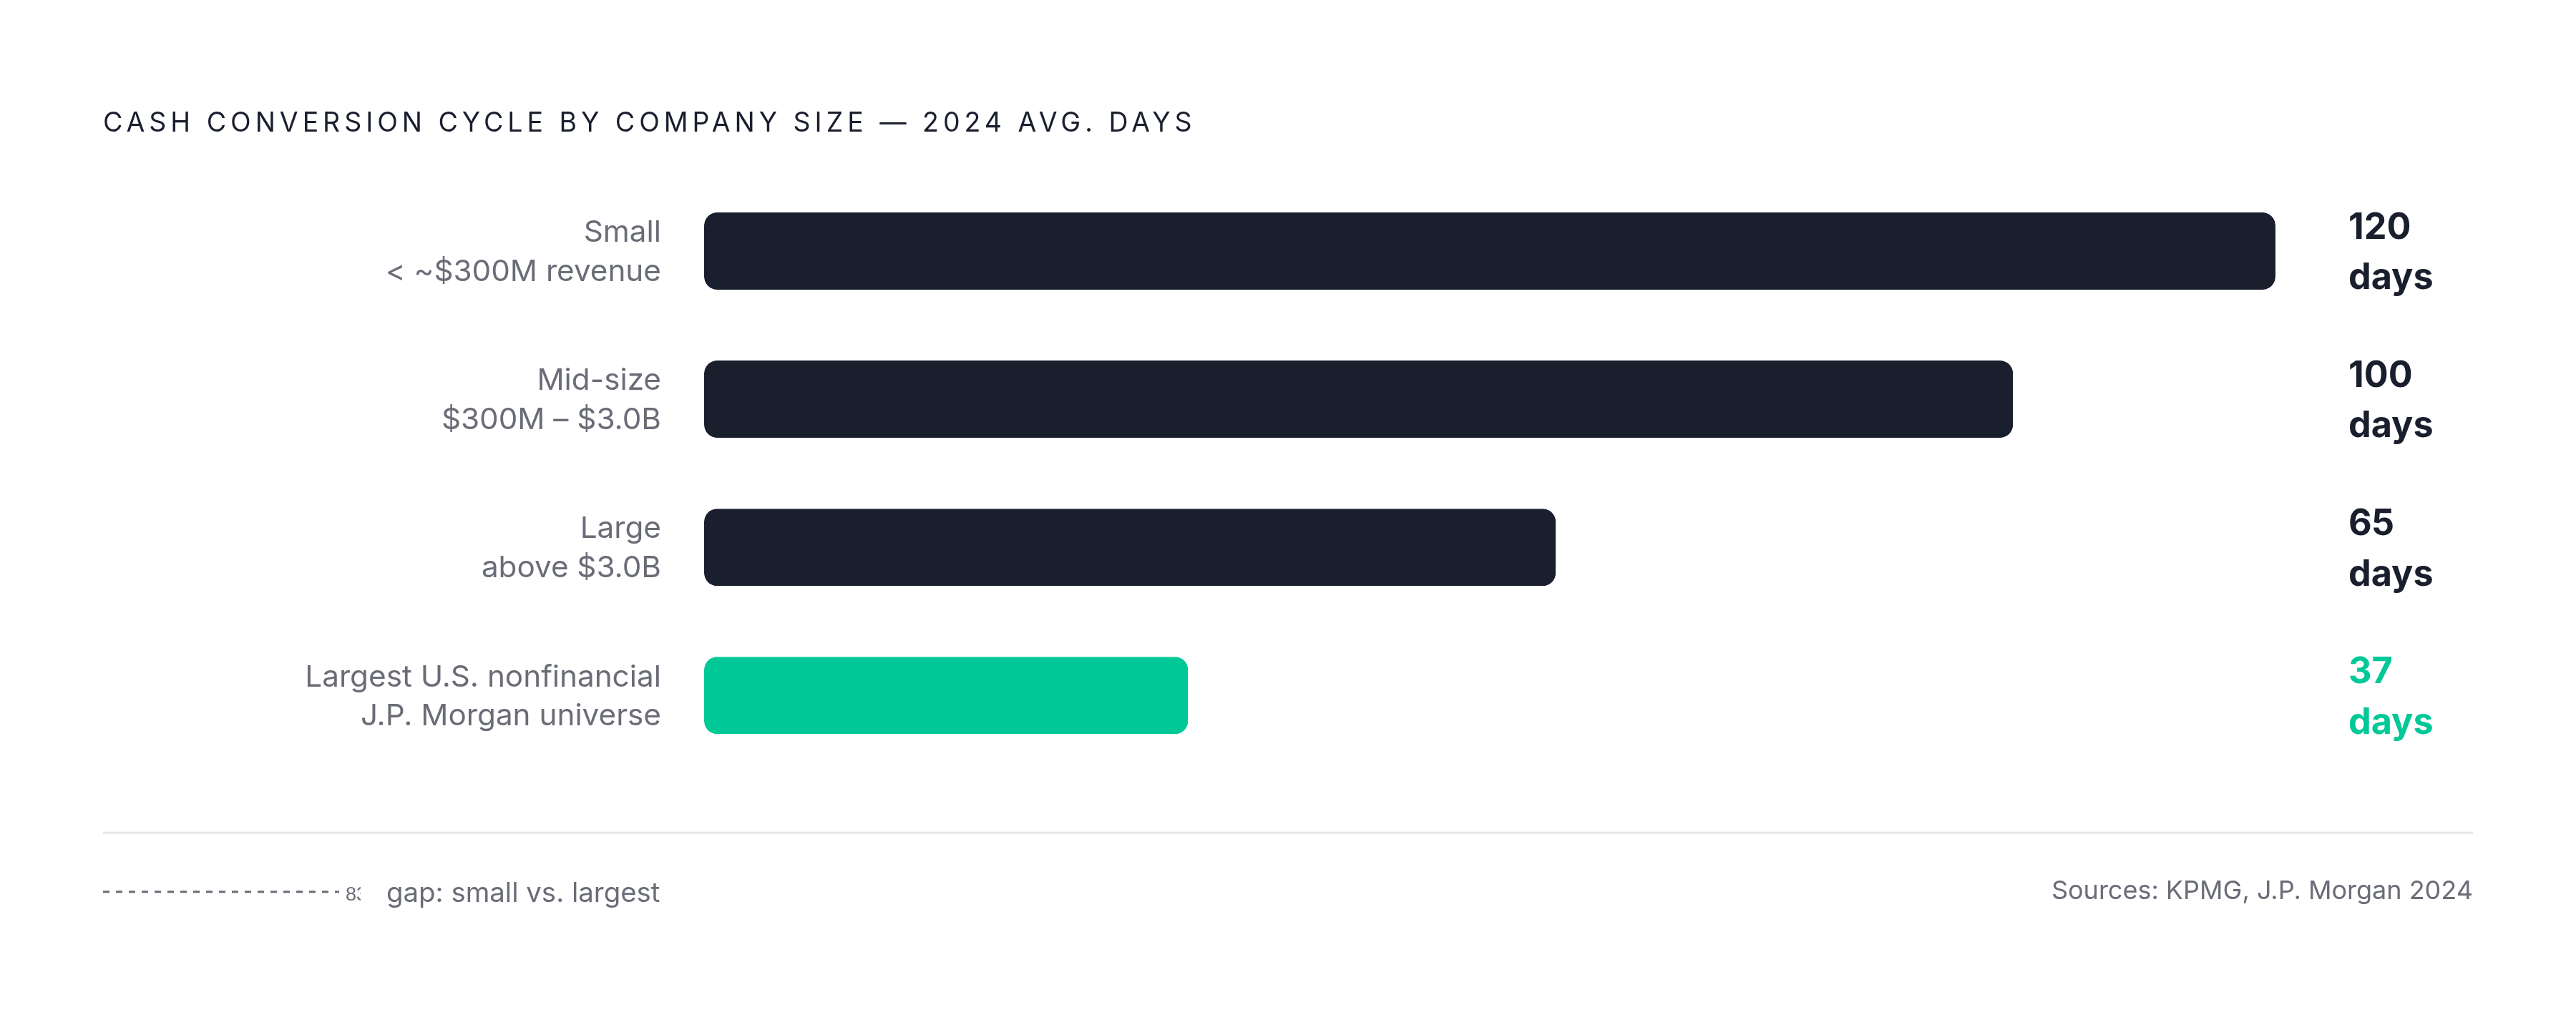
The J.P. Morgan Working Capital Index for 2024 shows a much lower average CCC of 37 days for the largest U.S. nonfinancial companies. That gap reflects what scale and negotiating power actually buy you, in concrete, measurable days.
DSO is the lever most directly in the finance team's hands. It is also the one most often left underworked.
How CCC Benchmarks Break Down by Industry and Company Size
A single cross-industry CCC benchmark is close to meaningless. The variation is just too extreme to make aggregate numbers useful for any actual decision.
From KPMG's 2024 data:
- Healthcare: 146-day median CCC. Interquartile range of 81 to 207 days. The spread alone tells you how diverse the business models within a single sector can be.
- Information Technology: 118-day median
- Industrials: 102-day median
- Consumer Discretionary: 19 to 128-day interquartile range within one sector. You cannot benchmark a fast fashion retailer against a luxury goods manufacturer and draw any useful conclusions.
Size matters just as much as sector:
- Small companies (below a few hundred million in revenue): 120-day CCC in 2024, down from the prior year. Still dramatically higher than larger peers.
- Mid-size companies ($300M to $3.0B): 100 days
- Large companies (above $3.0B): Improved from 67 to 65 days. Scale brings negotiating power on both payables and receivables, and it shows up in the numbers.
PwC's 2024 Working Capital Study breaks it down by business model:
- Manufacturers: 60 to 90 days
- Retailers: 20 to 40 days
- FMCG: 55 to 80 days
The number that should motivate most finance leaders: top-quartile companies consistently run 35 to 50% below their sector median CCC. That is not a small gap, and it is not explained by luck.
Two 2024 outliers worth noting: semiconductors and pharma. J.P. Morgan recorded average CCC extensions of 27.9 days and 7.3 days respectively, driven by surplus capacity, excess inventory across the value chain, and reduced end-user demand. Macro conditions can move the CCC dramatically. Another reason to track trends rather than fixate on single readings.
The $707 Billion Case for Taking Working Capital Efficiency Seriously
J.P. Morgan estimates that $707 billion in working capital could be released across S&P 1500 companies by optimizing DIO, DSO, and DPO. Days inventory outstanding alone accounts for $353 billion of that figure.
"Released" working capital is not theoretical. It is cash currently locked in inventory sitting in a warehouse, in receivables not yet collected, or in payables terms that were never renegotiated. Once freed, that cash is available for debt paydown, reinvestment, dividends, or simply as a buffer against the next disruption. No external capital required.
The opportunity is not evenly distributed. Small companies carry the heaviest CCC burden (120 days versus 65 days for large companies), so they have proportionally the most to gain from improvement. Companies in sectors with wide interquartile ranges (Healthcare and Consumer Discretionary especially) have the most benchmarking room to work with. If your peers are running 80-day CCCs and you are sitting at 140, that gap is a real target.
The receivables piece gets underappreciated relative to the inventory conversation, which I find genuinely puzzling. DSO sitting at 51 days in 2024 means every single day of improvement across a large AR book is material cash. And unlike inventory optimization, reducing DSO does not require supply chain restructuring. It requires consistent, systematic follow-through on collections. More operational discipline than strategic overhaul.
Negative Working Capital as a Design Choice, Not a Failure
Amazon, Walmart, and McDonald's all run negative working capital. On purpose.
Walmart has averaged tens of billions in negative working capital over the last five years. The mechanism is straightforward: accounts payable exceeds receivables and inventory combined. Suppliers extend credit while customers pay at the point of sale. Walmart collects before it pays. Every day.
Amazon's retail division takes this further with a negative cash conversion cycle. Customers pay before Amazon pays its suppliers. Suppliers are, in effect, financing Amazon's inventory in the interim. Negative CCC is the logical endpoint of working capital efficiency when you have pricing power over suppliers and cash-at-sale with customers.
What separates designed negative working capital from actual distress?
- Revenue growth and consistent operating cash flow. The model is generating cash, not consuming it.
- Supplier relationships and negotiating leverage that make extended payables genuinely sustainable, not just deferred problems.
- Fast inventory turns. Liabilities do not accumulate relative to assets because inventory moves quickly enough to prevent it.
Most B2B companies will never get to negative territory. That is fine. The directional principle still applies: shorten the gap between outflows and inflows, rather than maintaining a comfortable static ratio that does not actually tell you much about cash velocity.
A ratio below 1.0 always requires a follow-on question. Is this a structural feature of a cash-efficient model, or is liquidity actually deteriorating? Those two situations call for completely different responses. Conflating them is an expensive mistake.
Where Accounts Receivable Sits in the Working Capital Picture (and Why It's the Most Actionable Lever)
Accounts receivable is the component of working capital that finance teams have the most direct control over. Inventory levels are driven by supply chain decisions and demand forecasting that often sit outside finance's lane entirely. Payables terms depend on supplier negotiations that can take months or years to renegotiate.
Receivables, though, that is a collections process. A follow-up workflow. A set of policies your team can actually move without waiting for anyone else to sign off.
DSO captures AR efficiency within the CCC framework. And as the 2024 data shows, the average U.S. public company is sitting at 51 days. For most B2B businesses, the gap between invoicing and collecting is where working capital quietly bleeds out, usually not because of structural problems, but because of sloppy process.
The reasons DSO stays stubbornly high tend to be process problems, not structural ones:
- Invoices sent late or with errors that trigger disputes and restart the clock
- No systematic follow-up cadence once an invoice ages past due
- Manual processes that make it hard to prioritize which accounts actually need attention
- Lack of visibility into which invoices are at risk before they become overdue
Those are rarely hard to fix. They do not require a business model overhaul.
Finance teams that systematically reduce DSO typically invest in AR automation tools that handle dunning sequences, payment reminders, and collections prioritization. Billtrust, HighRadius, and Centime all operate in that space, with different strengths around workflow automation, payment processing, and cash flow forecasting.
What do you call a company that never follows up on its invoices? Charitable. Every day shaved off DSO is cash back in the business. No new capital raised. No supply chain renegotiated. Just faster collection of money that was already yours.
AR is not a back-office function. It is a working capital lever, and treating it as anything less is leaving money on the table.