Accounts Receivable Days Formula and Interpretation
Pick the right formula based on how your business actually sells, not which version looks simplest.

Accounts receivable days is one of those metrics that looks simple on the surface and then slowly reveals itself to be anything but. The formula is straightforward. The interpretation is where people get into trouble. And the benchmarks? Wildly context-dependent in ways that most quick-reference guides quietly gloss over.
Here is the core idea: AR days (also called Days Sales Outstanding, or DSO, or Average Collection Period, or debtor days. all the same thing, different audiences) counts how many days it takes your business to collect cash after a credit sale closes. That is it. One number, one job. You could say DSO is like a stopwatch for your cash — it starts ticking the moment you close a deal and stops only when the money actually lands.
What it does not tell you: whether the sale was profitable, whether the customer is creditworthy, or anything about your revenue quality. It is a collection timing metric. Full stop.
One thing worth flagging before we go further: cash sales are excluded by definition. A customer who pays at the point of sale contributes zero days to the average. Folding them in would drag your DSO down artificially and make your collections look better than they are. The metric is only about credit sales. Keep that clean.
The reason this needs explaining before we get to the formula is that the inputs and period choices change the result in ways that matter. A single number, but the version you use shapes what that number actually says. So let us start there.
The Three Formula Versions and When Each One Applies
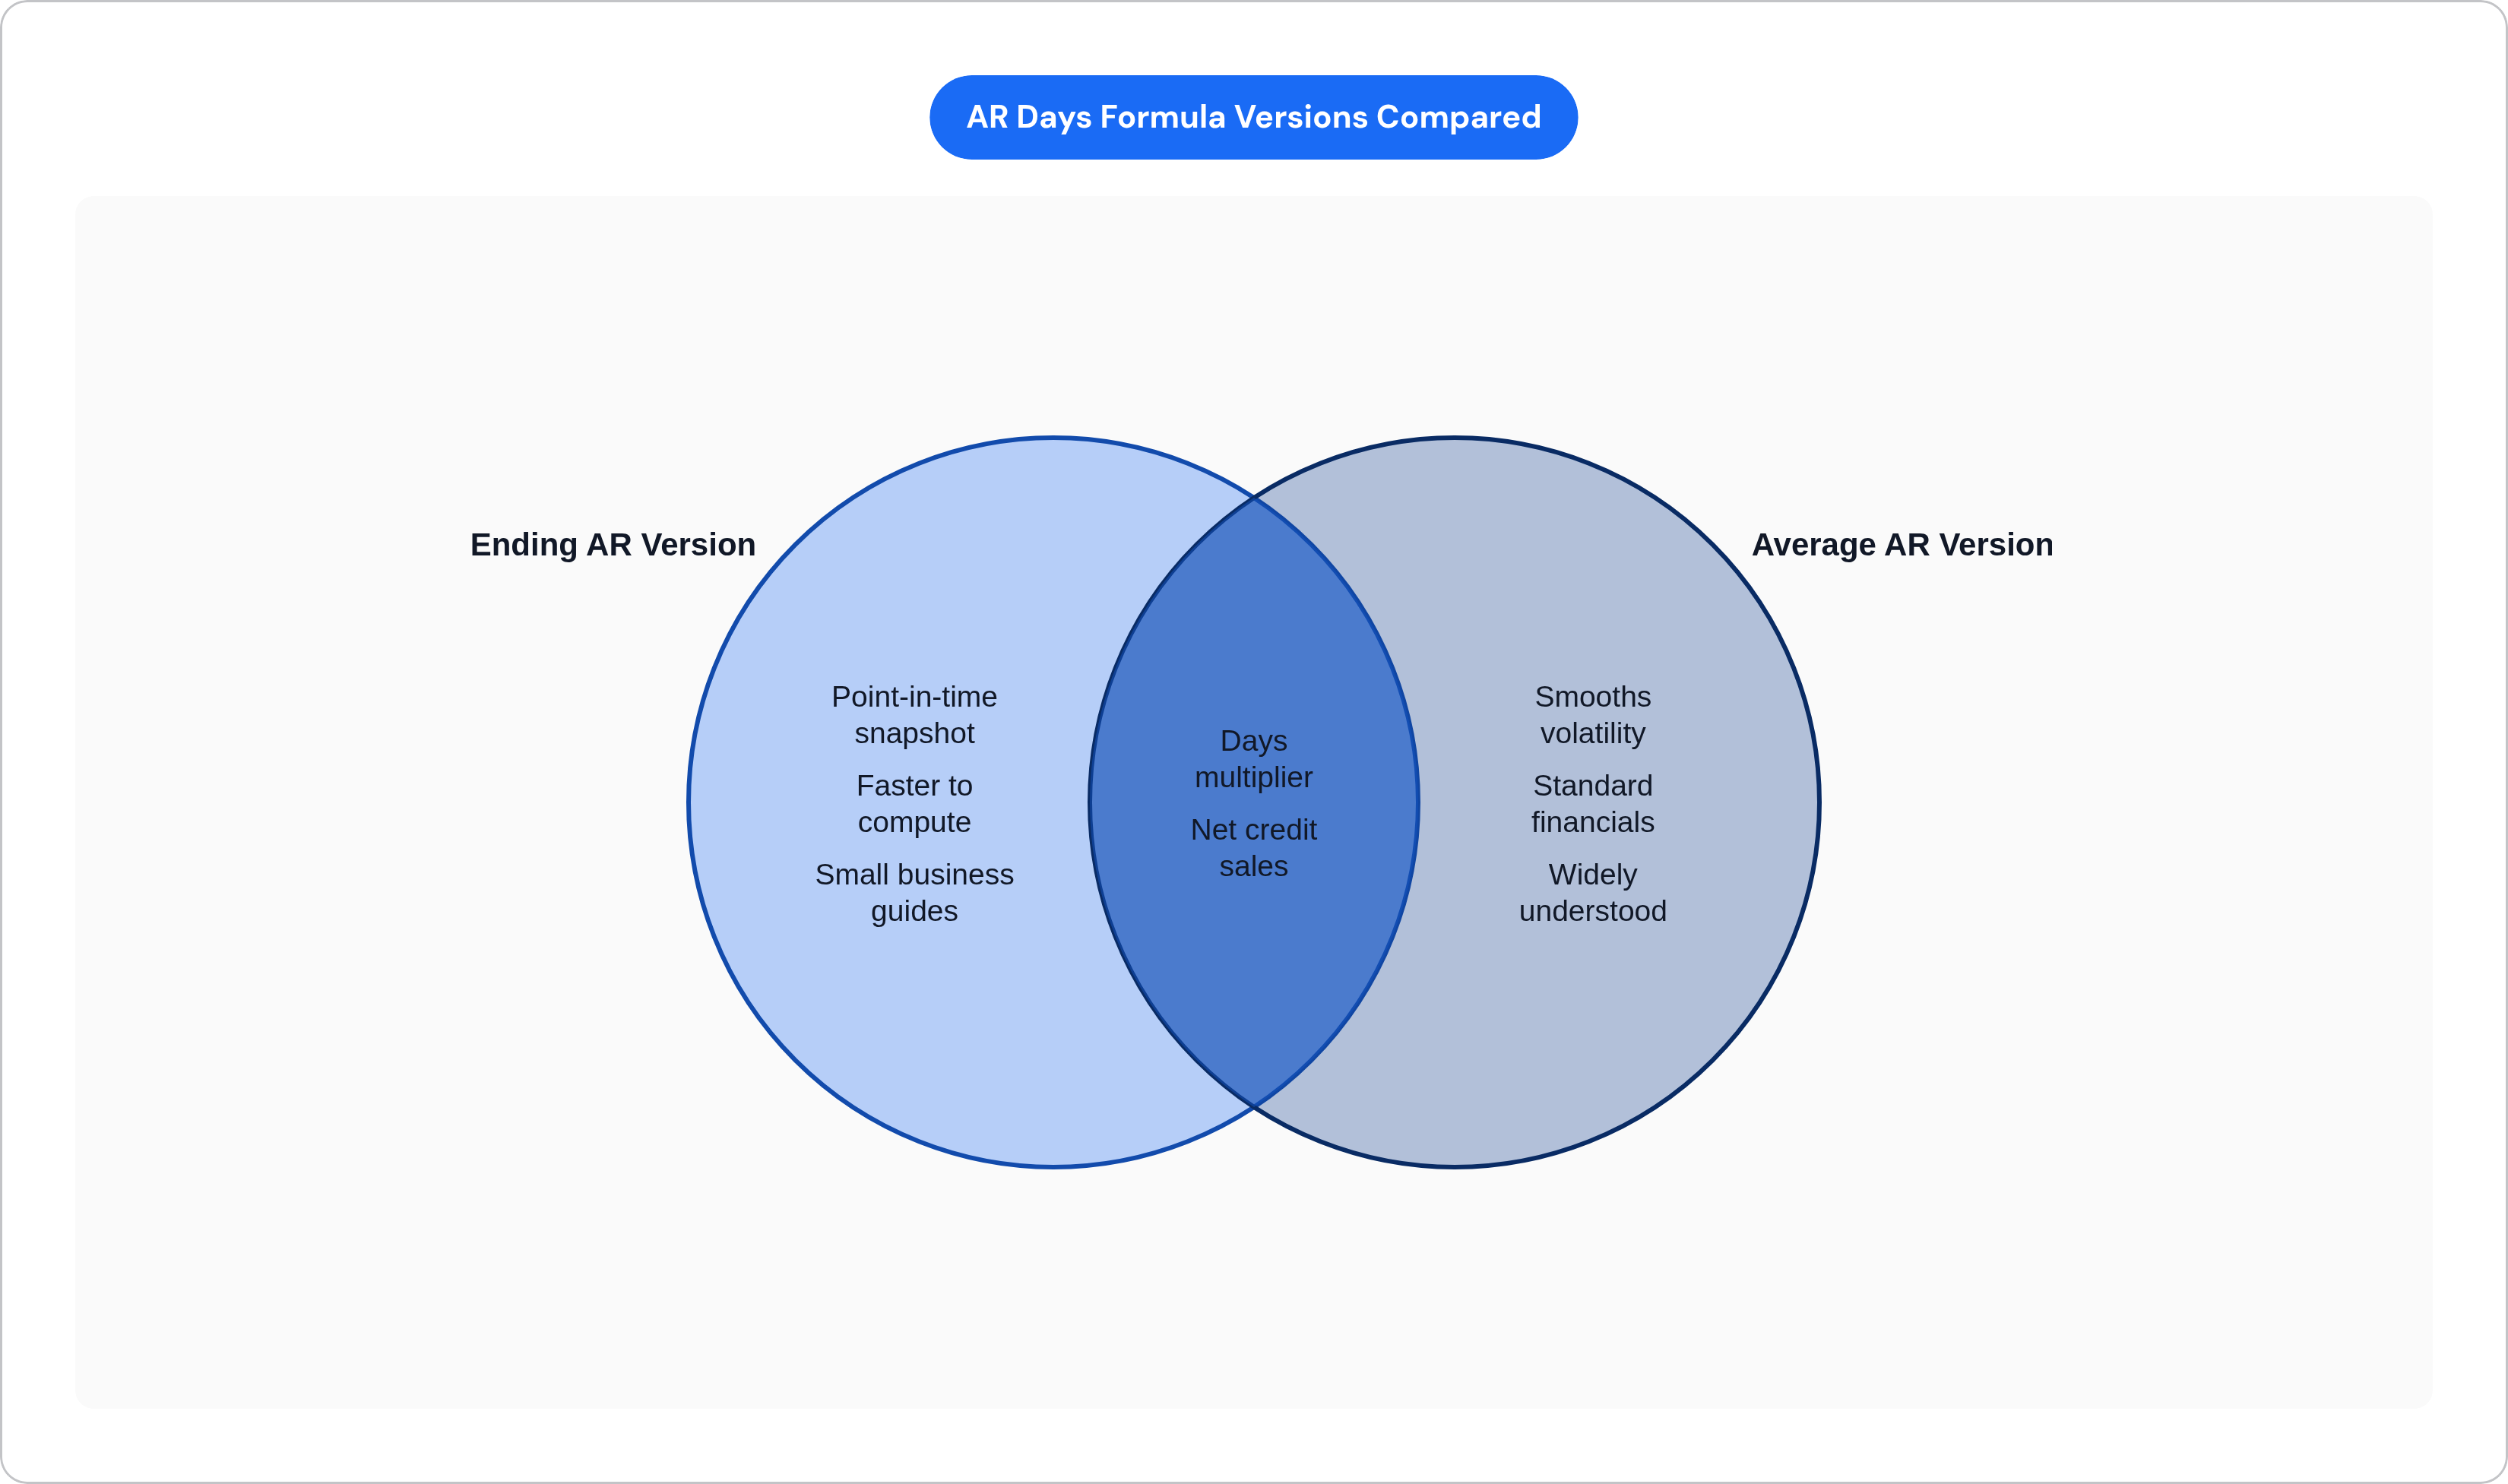
There are three versions in common, legitimate use. They are not just stylistic variants. They answer slightly different questions.
Version 1: The practical default (Average AR ÷ Revenue) × 365
This is the one you will see most often in B2B finance contexts. Average AR smooths out within-period swings by taking the opening and closing AR balance, adding them together, and dividing by two. The denominator uses total revenue rather than credit-only sales.
For businesses where nearly all revenue comes in on credit terms, this works fine. The denominator is close enough to net credit sales that the imprecision does not matter much. It is fast, it is widely understood, and the inputs are easy to pull from standard financials.
Version 2: The technically precise version (Average AR ÷ Net Credit Sales) × Number of Days
This one strips cash and card transactions out of the denominator. If a meaningful chunk of your revenue is paid immediately at point of sale, using total revenue in the denominator will understate your actual DSO. The precise version fixes that.
It is more accurate. It also requires clean data that separates credit sales from cash sales, which not every accounting system tracks separately. Academic finance prefers this version. So do controllers at businesses with material non-credit revenue.
Version 3: The snapshot version (Ending AR ÷ Net Credit Sales) × Number of Days
Same logic as version 2 but uses the closing AR balance rather than an average. Faster to compute. Common in small business guides and quick-reference tools.
The tradeoff: if your AR balance bounces around significantly during the period, the ending balance is not representative. It can overstate or understate the real picture depending on whether you closed the period high or low.
The two choices that separate all three versions:
- Ending AR vs. average AR. Average smooths volatility. Ending is a point-in-time snapshot.
- Total revenue vs. net credit sales. Net credit sales is more precise. Total revenue is close enough when cash sales are immaterial.
A note on the period multiplier: 365 for annual calculations, 90 for quarterly, 30 for monthly. Whatever revenue figure you use, the days multiplier has to match. Mixing an annual AR balance with a quarterly revenue figure without adjusting will produce a number that is simply wrong.
One more approach worth knowing: the countback method. This one works backward from the AR balance through recent months of actual revenue until the balance is fully accounted for. It is the preferred approach for seasonal businesses or any company with uneven revenue across the year. The standard averaging methods are badly distorted by months of near-zero activity. If you closed for six weeks in the summer, that silence gets baked into your average in a way that muddles the result. Countback sidesteps that problem entirely.
The right formula is the one whose inputs actually reflect how your business sells. Start there, not with which version looks cleanest.
A Worked Calculation From Raw Inputs to a Result
Let us walk through it with real numbers so the mechanics are concrete.
Step 1: Get your AR balance. If you are using average AR, pull the opening and closing balances from your balance sheet and divide by two. If you are using the snapshot version, take the closing balance directly.
Step 2: Identify your revenue figure. Total revenue or net credit sales, depending on which formula version you chose. Confirm the period covered matches the days multiplier you plan to use.
Step 3: Apply the formula and check your units. The result should be in days. If you get a decimal fraction less than one, something is mismatched in your inputs.
A concrete example: Say a company has $120,000 in accounts receivable and $800,000 in annual revenue. Using the primary formula:
($120,000 ÷ $800,000) × 365 = 54.75 days
If that company operates on net-30 payment terms, customers are paying roughly 25 days late on average. The number tells you there is a gap. It does not tell you why. Billing disputes, slow internal invoice generation, customer portal friction, missing documentation. all are plausible causes. The metric surfaces the problem; diagnosing it requires a different conversation. Think of DSO as the smoke alarm — it tells you something is burning, but you still have to find the fire.
One adjustment worth making: bad debt. Net AR equals gross AR minus your allowance for doubtful accounts. Using net AR in the numerator gives you a more conservative and realistic DSO. Gross AR inflates the metric by including balances you are unlikely to ever collect. If your reserves are material, use net.
Common mistakes that produce bad numbers:
- Mixing an annual AR balance with a quarterly revenue figure without adjusting the days multiplier
- Using total revenue when cash sales are significant enough to distort the denominator
- Treating ending AR as if it were average AR without checking whether the balance was unusually high or low at period close
None of these are exotic errors. They happen all the time in fast-moving environments where someone grabs the closest available number rather than the right one.
How to Read the Result: What High, Low, and "About Right" Actually Mean
The number on its own means nothing. The first comparison is always against your own stated payment terms. That is your baseline.
When AR days is high: Customers are taking longer to pay than your terms require. That can mean collection inefficiency, a lenient credit policy, billing disputes, or just slow payment on the customer's end. Persistently high DSO ties up working capital in a very real, very annoying way. It can force a business to borrow operating cash against receivables it is theoretically owed but has not yet collected. And rising DSO can signal building bad debt. The older a receivable gets, the less likely it is to be collected in full.
When AR days is low: Efficient collection. Good, right? Usually. But if AR days is dramatically below the credit period you offer, your credit policy is too tight. You are turning away customers who can pay, just more slowly than your current cutoff allows. The goal is not to minimize DSO. The goal is alignment with your terms and your broader business strategy.
A practical rule of thumb: If your terms are net 30, an AR days figure around 37 to 38 days (roughly 25% above the limit) suggests room for improvement but is not cause for alarm. Significantly higher than that signals a process problem worth investigating.
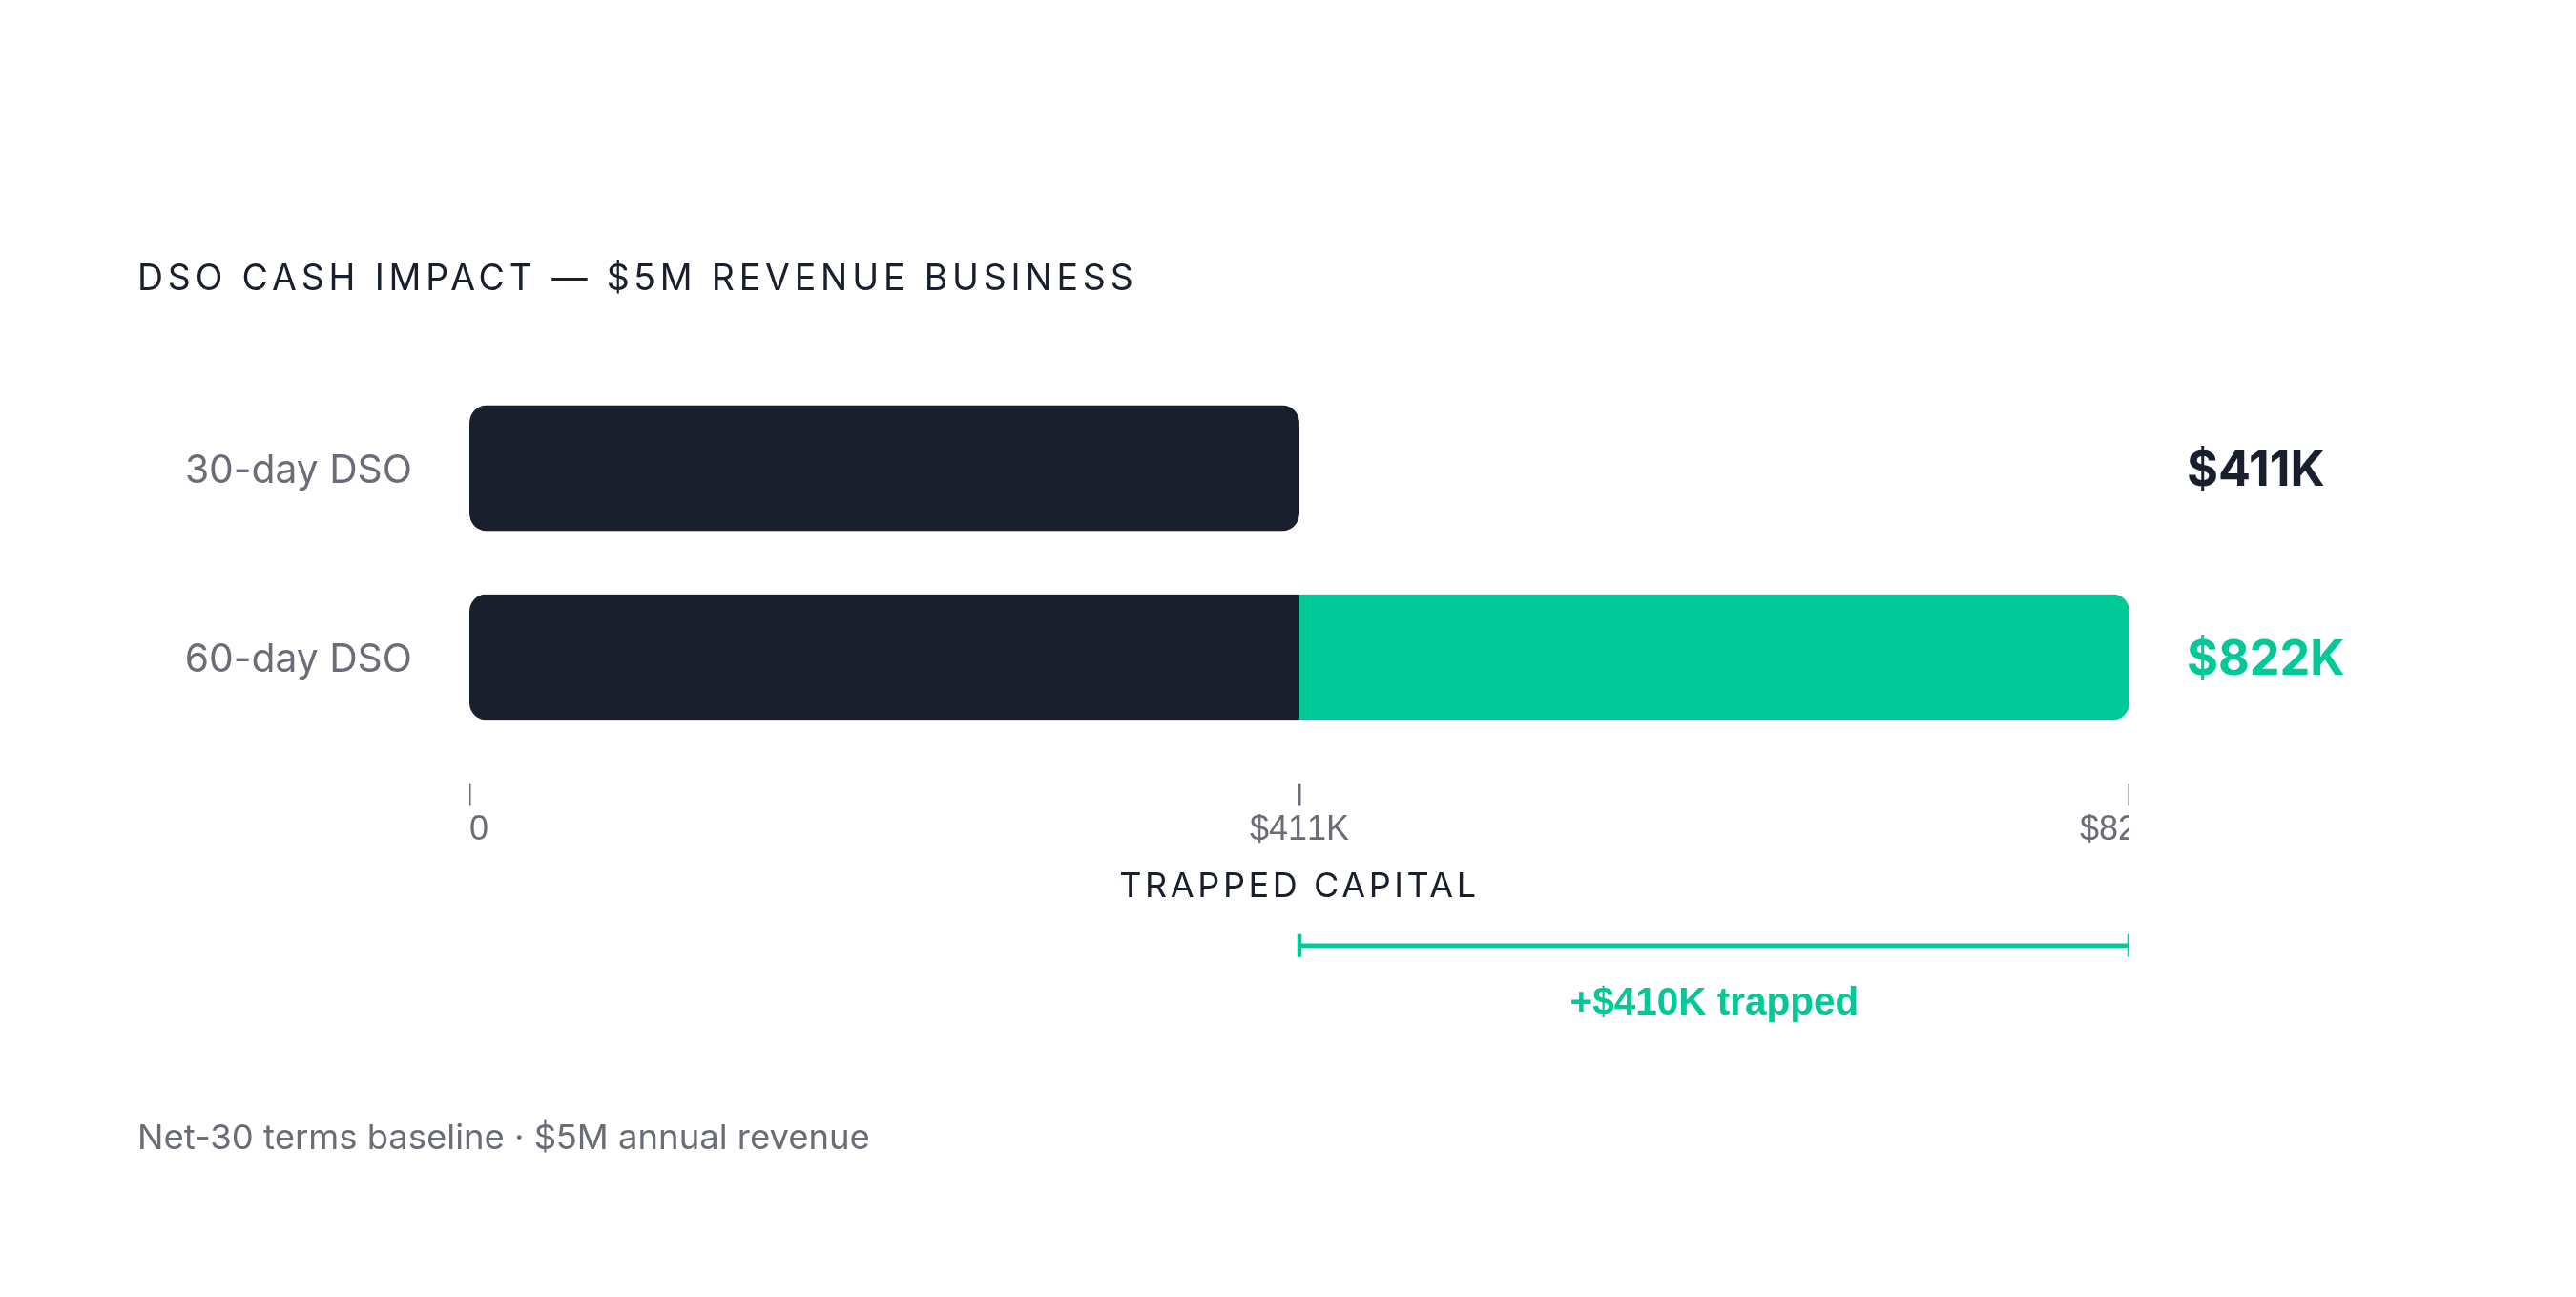
The working capital stakes are real: The difference between a 30-day and a 60-day DSO on a $5 million revenue business is roughly $410,000 in additional capital sitting in unpaid invoices. That is not an accounting abstraction. That is cash unavailable for hiring, inventory, or reinvestment until the invoices clear.
Scale matters here. A large company with strong liquidity absorbs a 60-day DSO without much strain. A capital-constrained smaller business with the same number is managing a genuine liquidity problem every quarter.
Beyond operations: lenders, investors, and acquirers all look at working capital metrics closely. DSO is not just an operational indicator. It sends signals about how well-run the business is, how predictable cash flows are, and how much hidden risk sits in the AR balance. When a company raises capital, seeks a loan, or goes through an acquisition process, these numbers get scrutinized in detail.
What Current Benchmarks Look Like Across the Market
Here is the tension: general convention holds that DSO under 45 days reflects strong collection performance. The market-wide trend is running in the opposite direction.
Current reference points:
- A DSO of 45 days or below is widely cited as efficient performance
- Hackett Group data puts the median DSO at 43.5 days, with top-quartile companies collecting in 25.1 days. That is an 18-day gap between median and best-in-class
- Credit Research Foundation Q4 2025 data shows a broad domestic trade receivables median of 40.50 days
What is actually happening in the market:
- Allianz Research data from 2025 shows global DSO rising to approximately 50 to 54 days. 44% of companies reported DSO above 60 days. 21% reported above 90 days.
- In 2023, global DSO increased by 3 days. That was the largest single-year jump since 2008, affecting nearly every sector monitored
- J.P. Morgan identified $707 billion of trapped working capital across the S&P 1500 in 2024. 67% of those companies reported a longer DSO than the prior year
- A 2025 Hackett Group survey found that accounts receivable now represent 35% of total excess working capital across large nonfinancial public companies. The single largest source of trapped cash
Context: the semiconductor example. In a recent period, semiconductor sector DSO rose by 17%, the steepest increase in more than a decade. But this was not a collection failure. Chipmakers deliberately extended terms to major customers (hyperscalers and AI infrastructure buyers) in exchange for long-term supply commitments, even as revenue grew 28%. Rising DSO reflected a deliberate strategic tradeoff, not a broken AR process.
That is the thing about this metric. A number that looks alarming in isolation is entirely rational in context. You have to know why before you can judge it.
One more tool worth knowing: Best Possible DSO, or BPDSO, represents the lowest DSO a company achieves if every current receivable paid exactly on time. Comparing actual DSO against BPDSO isolates how much of the gap is structural (terms you have intentionally extended) versus operational (invoices that should have been paid but were not). It is a useful internal benchmark when external comparisons are not telling you enough.
Why Industry Benchmarks Vary So Widely and How to Use Them Correctly
There is no universally "good" AR days figure. Payment terms and billing structures are too different across industries for a single number to travel cleanly.
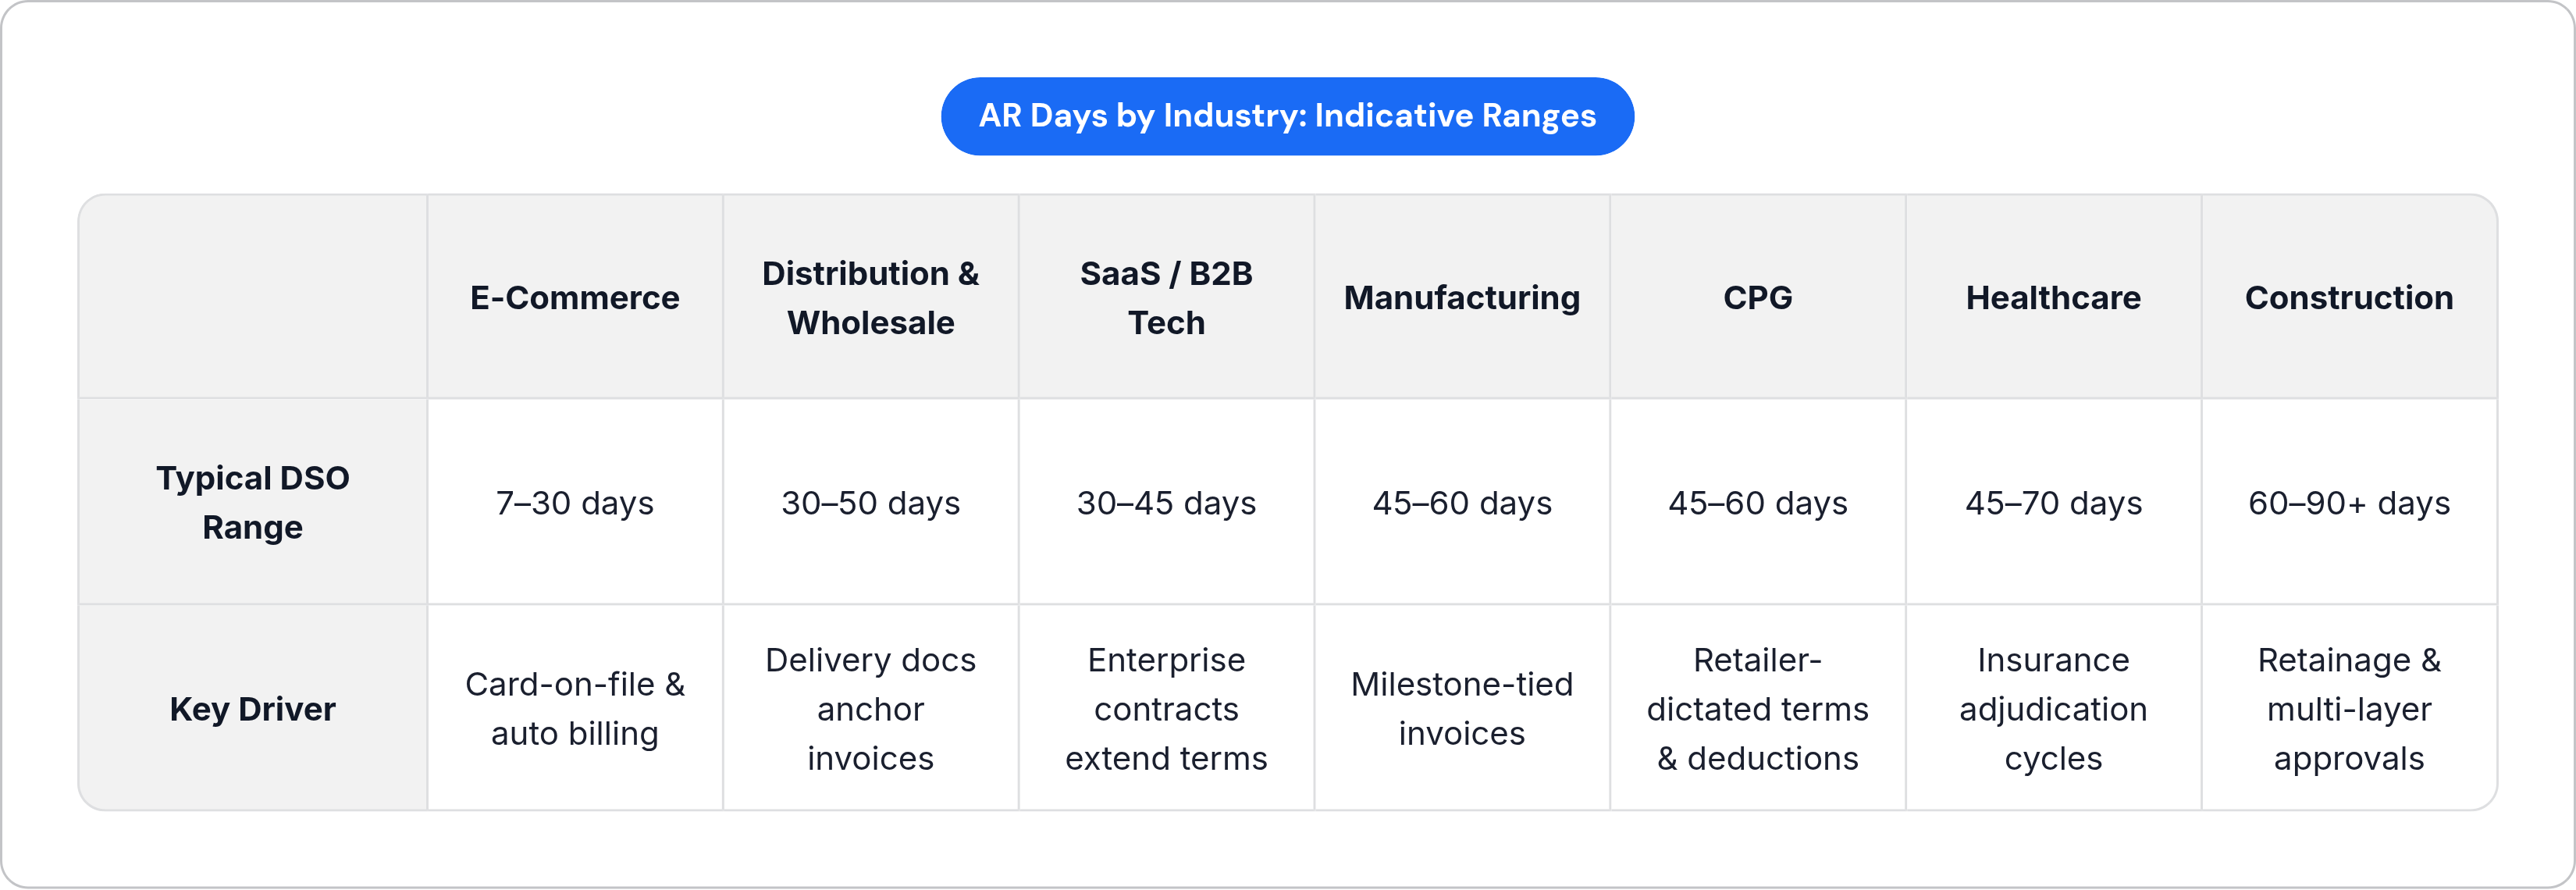
Indicative ranges by sector:
- E-commerce: 7 to 30 days. Card-on-file and automated billing compress the cycle significantly.
- Distribution and wholesale: 30 to 50 days. Delivery documentation anchors invoices and reduces dispute windows.
- SaaS and B2B tech: 30 to 45 days typically, though enterprise contracts run 60 to 90 days by design.
- Manufacturing: 45 to 60 days. Invoices often tie to delivery or completion milestones, and high-value custom orders require more approval layers on the buyer side.
- CPG: 45 to 60 days. Large retailers dictate terms and generate high volumes of deductions that inflate effective recovery time.
- Healthcare: 45 to 70 days. Insurance adjudication and denial-and-resubmission cycles consume 30 to 60 days before patient payment even begins.
- Construction: 60 to 90+ days. Retainage, progress billing, and multiple approval layers are standard. Nearly half of construction companies report late payment as a persistent condition.
The within-industry problem: Construction is the clearest example of why industry averages can mislead. A residential remodeler carries a 30 to 45-day DSO. A commercial general contractor runs 75 to 95 days. Both are "construction." An industry-wide average blends two essentially different cash flow regimes into a single number that represents neither of them accurately.
Comparing your DSO against a broad industry average in a situation like this produces a meaningless result. You need a same-segment, same-size peer group. Same industry alone is not enough.
Trend beats snapshot: A 50-day DSO that has been improving steadily from 65 days is a better operational signal than a 45-day DSO that has been drifting upward for three consecutive quarters. The direction of travel matters as much as the level.
Where AR Days Fits Inside the Cash Conversion Cycle
AR days does not exist in isolation. It is one of three inputs to the cash conversion cycle (CCC), which is the broadest measure of how efficiently a business converts its operations into cash.
The three components:
- DSO (Days Sales Outstanding): time from sale to cash collection
- DIO (Days Inventory Outstanding): time to turn inventory into a sale
- DPO (Days Payable Outstanding): time taken to pay suppliers
The formula: CCC = DSO + DIO minus DPO
Lower CCC means cash cycles through the business faster. Paying suppliers more slowly (higher DPO) improves the cycle. Collecting receivables faster (lower DSO) improves it. Selling inventory faster (lower DIO) improves it. All three levers work together.
DSO improvements compound. Reducing DSO by 10 days in a business with meaningful revenue frees a material amount of cash that would otherwise sit in outstanding invoices. The $410,000 figure from earlier gives you a sense of the order of magnitude at $5 million in revenue. Scale that up and the number gets consequential fast.
AR days as a forecasting tool: Standard financial modeling uses the formula in reverse to project future AR balances:
Forecasted AR = AR Days × (Revenue ÷ 365)
This allows the AR line on a balance sheet forecast to move in sync with revenue projections rather than being held artificially flat. It makes models more accurate and more useful.
Two distinct uses, one metric: Backward-looking: measuring collection efficiency against historical performance. Forward-looking: projecting future cash needs and AR balances in financial models.
For anyone managing cash flow at the leadership level, the real value is not in any single AR days figure. It is in tracking the metric across rolling periods. A trend line shows whether operational changes (new invoicing workflows, payment portal integrations, follow-up cadences) are actually moving the needle, which is the kind of persistent follow-up work that Invoice Butler, an AI-powered accounts receivable tool that automates invoice chasing across email, phone, and SMS with human collections experts behind it, was built to systematize. A single data point tells you where you are. A trend line tells you whether what you are doing is working.