Days Sales Outstanding by Industry Benchmarks
Understand how your industry's payment structure sets DSO expectations, not just collection effort.

DSO (Days Sales Outstanding) tells you how long it takes to turn a credit sale into cash in the bank. This piece walks through what the number actually measures, why it swings so wildly from one industry to the next, and how to use a benchmark without fooling yourself.
The formula is simple: divide accounts receivable by total credit sales, then multiply by the number of days in the period. What trips people up is the word "credit." Cash sales settle at the register and never touch this math, so a business with a lot of cash volume will show a DSO that looks great on paper and means less than it seems. There are two ways to run the calculation. The simple method just averages a period and works fine if your revenue is steady month to month. The countback method works backward through prior months of revenue to match receivables to the period they actually came from, and most CFOs prefer it because it holds up better when revenue is lumpy or seasonal. One more catch worth flagging up front: DSO is a blended average. It won't tell you if you're collecting everything in 25 days flat, or if you're collecting most of it in 15 and dragging a handful of accounts that are 200 days overdue. Same headline number, very different problem.
Where the overall market sits right now
Ask five sources what "normal" DSO looks like and you'll get five different answers, none of them wrong. The Credit Research Foundation's Q4 2025 data put the broad median at 40.5 days, leaning on smaller domestic B2B transactions. A 2024 industry report on B2B payments landed at a 56-day median across industries. Atradius, in its 2025 U.S. Payment Practices Barometer, found roughly 47 days for U.S. companies. Allianz Trade's global composite for 2023, covering tens of thousands of listed companies, came in at 59 days, the steepest single-year jump since the 2008 crash.
That's a 40-to-59-day spread among reputable sources, and none of them are measuring wrong. They're measuring different things: different sample sizes, public companies versus private ones, domestic-only versus global. Direction matters here as much as any single number does. The Hackett Group's 2025 U.S. Working Capital Survey, which tracks the top U.S. public nonfinancial companies, found DSO got worse for the second year running, largely because customers now have the leverage to push out payment terms. Hackett also sized the total problem: trillions of dollars sitting in excess working capital across these companies, and receivables now make up the single largest slice of that, worth hundreds of billions in money that could be freed up.
So treat any one benchmark as a reference range, not a scorecard. That's exactly why the industry-level detail below matters more than the headline figure.
Why industry structure determines DSO more than collection effort does
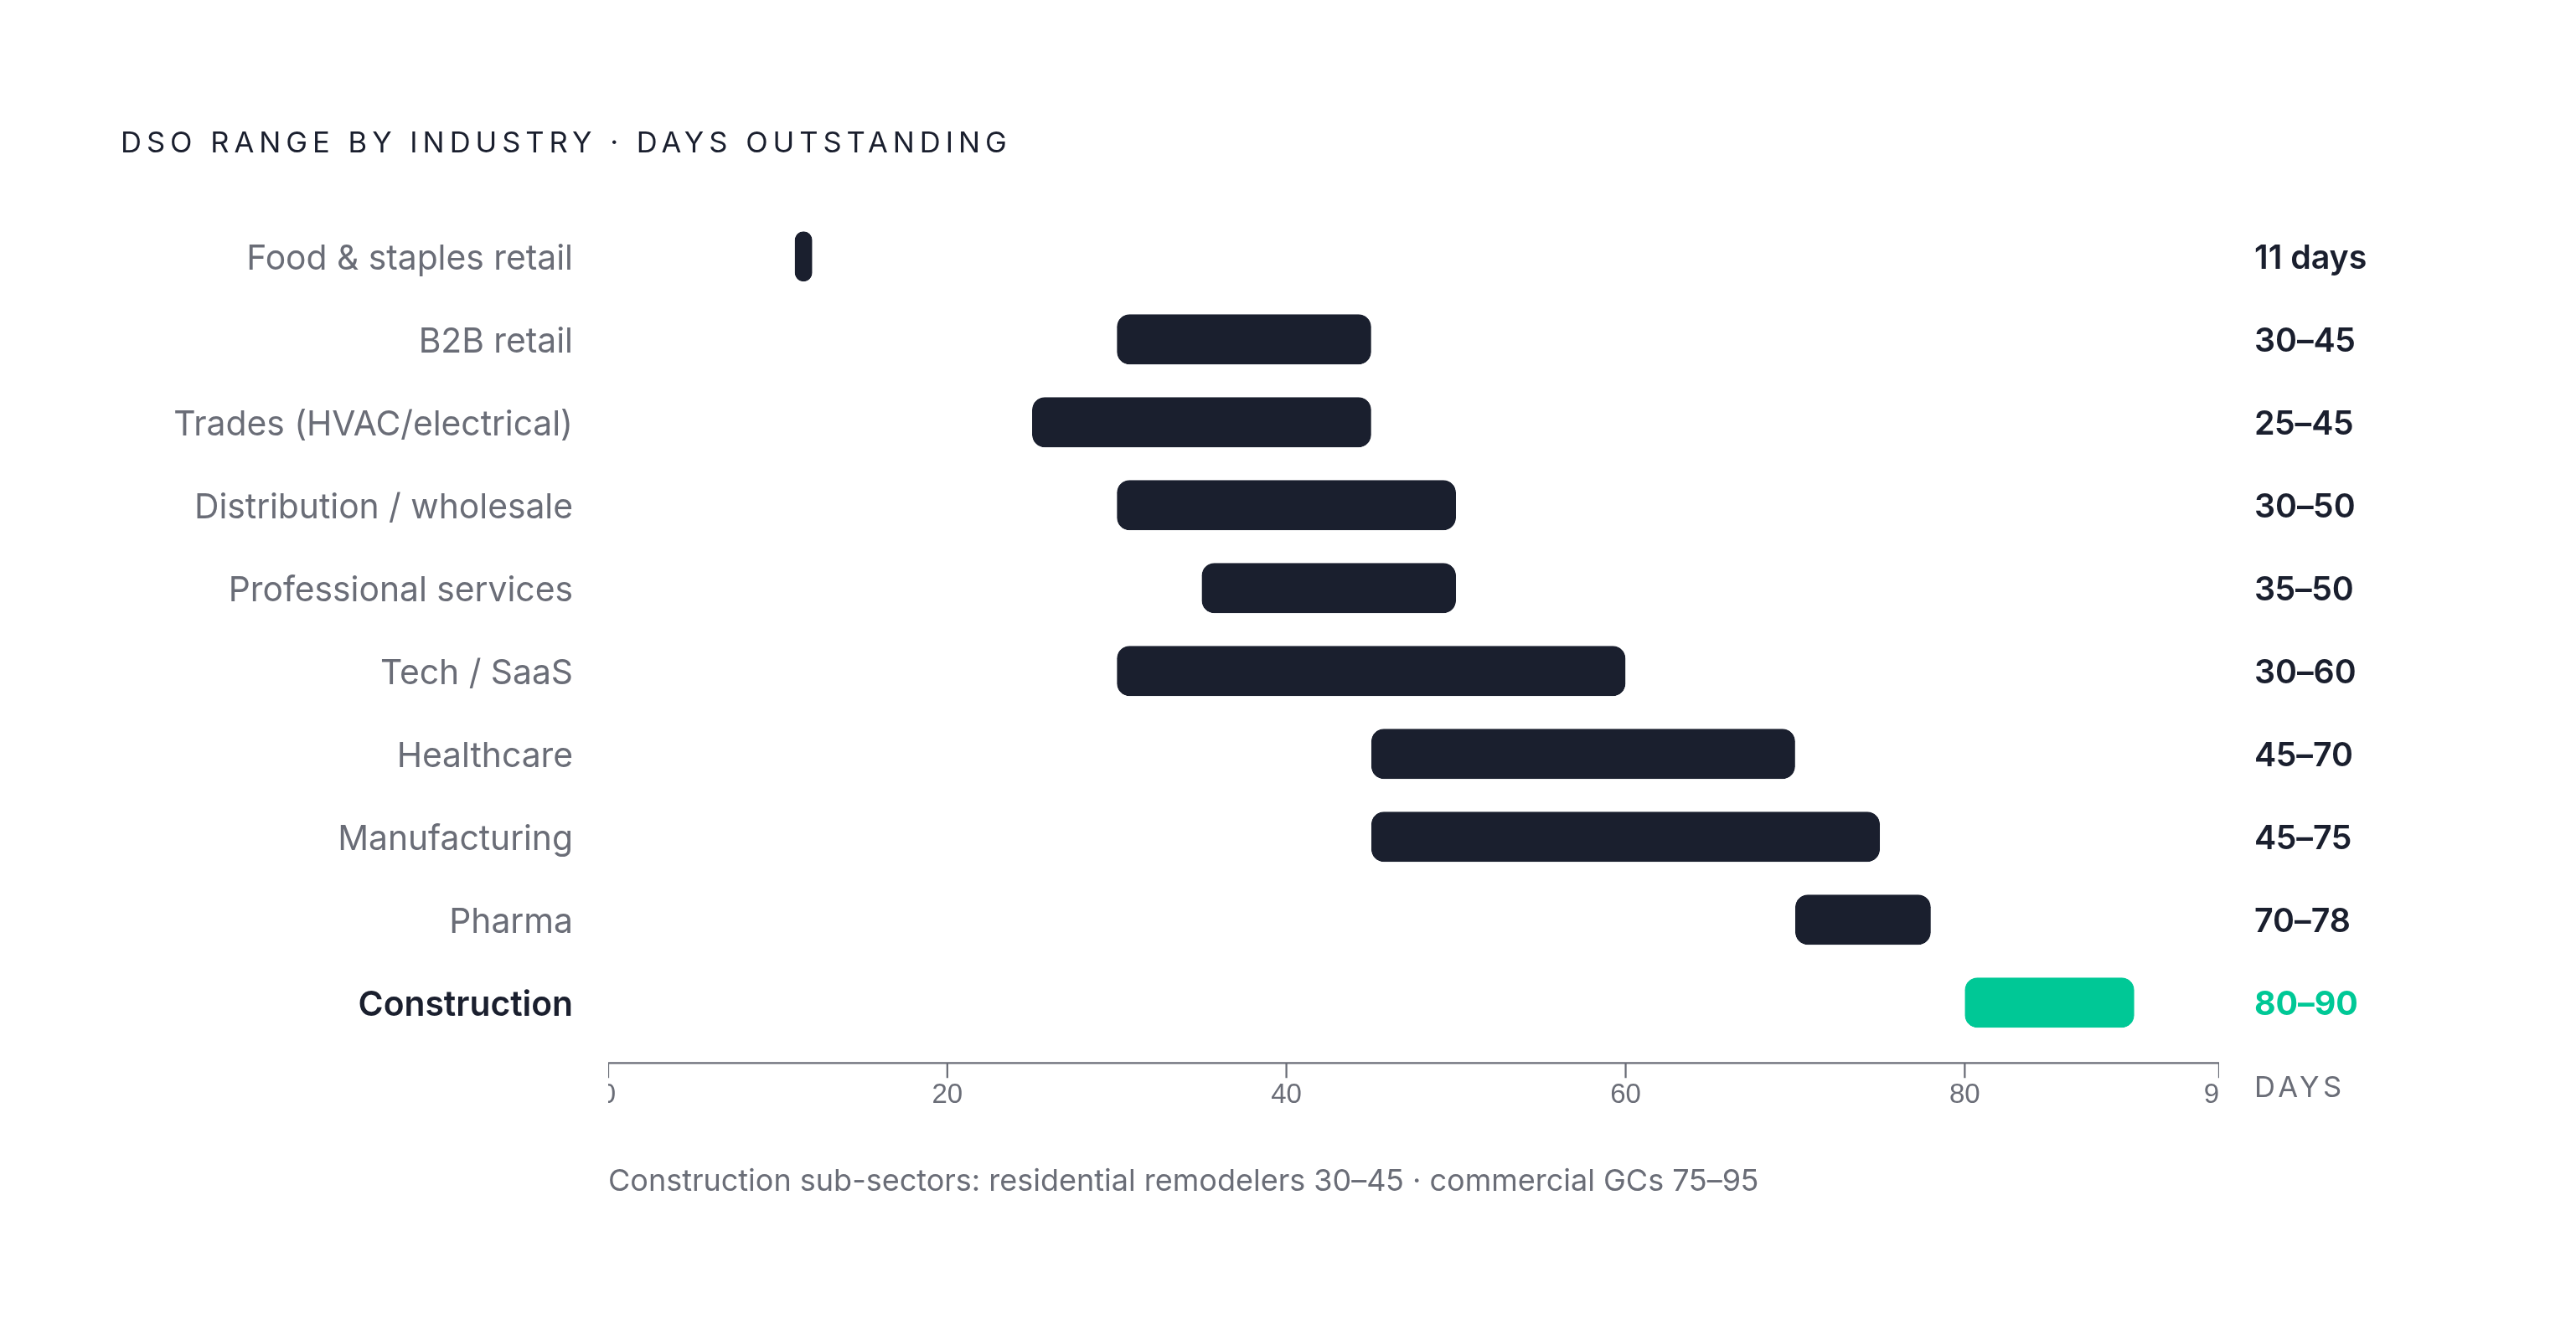
Across industries, DSO runs from around 15 days in B2B retail to 90 days in construction. That's a wider gap than most finance people expect, and it's not explained by who's better at chasing invoices.
Three things set a floor that collections can't touch. Contract terms are one: milestone billing, progress payments, and retainage clauses build delay into the deal before a single invoice goes out. Payer mix is another: government agencies and insurance companies run on their own statutory clocks, and no amount of polite follow-up moves those dates. Transaction complexity is the third: custom orders, multi-party sign-off chains, and disputes all stretch the cycle by design, not by accident.
Here's the upshot. A construction subcontractor sitting at 85 days might be running a tight ship for their sector. A SaaS company at the same number has a real problem on its hands. Benchmarks aren't there to hand you one universal target; they're there to separate what's baked into your industry from what you can actually go fix. That's the whole difference between a benchmark as a vanity stat and a benchmark as a diagnostic.
Sectors that collect fastest and why their structure allows it
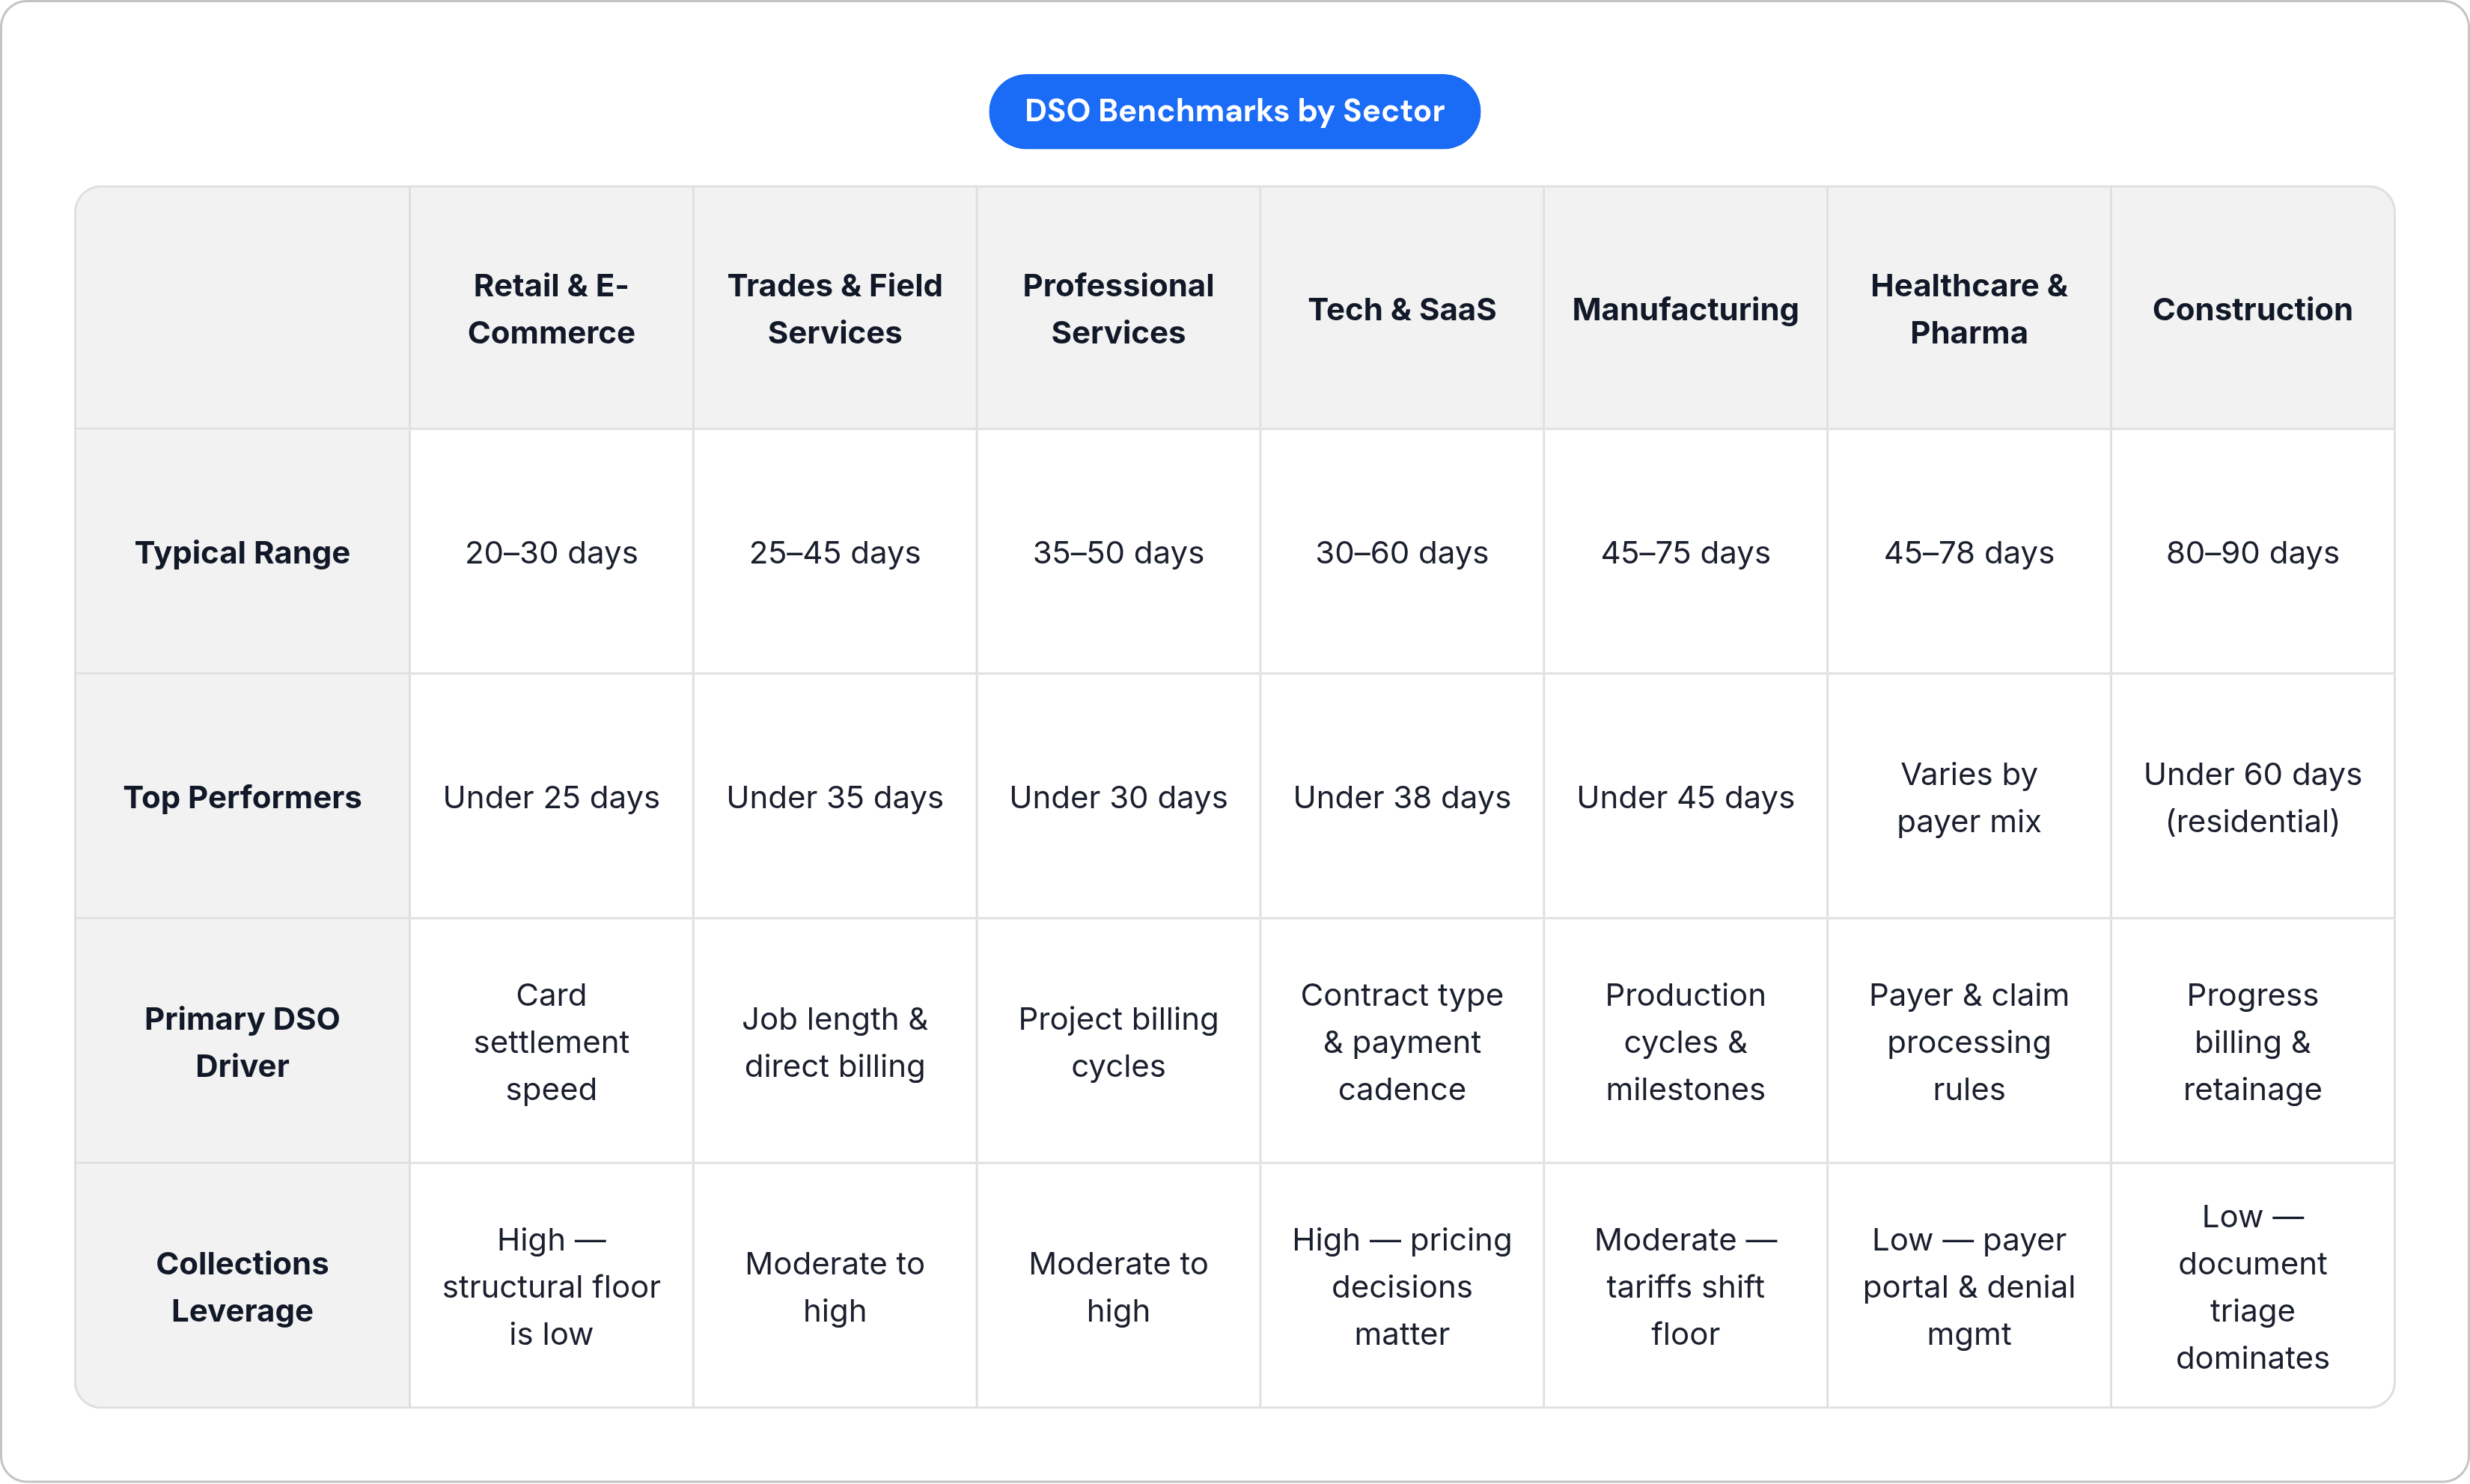
Retail and e-commerce sit at the fast end, typically 20 to 30 days, with food and staples retail averaging closer to 11. Card payments settle in one to three days, so DSO stays low almost automatically. B2B retail stretches that out to 30 or 45 days, and if a consumer-facing business creeps past 25 days, that's not slow customers, that's a broken payment gateway or something fishier.
Trades like HVAC, electrical, and plumbing land in a similar neighborhood: 25 to 35 days is strong, 35 to 45 is about average. Shorter jobs and a direct line to the customer keep the approval chain short. Compare that to general contractors in the same broad construction category running 60 to 90 days, and you can see how much the sub-sector matters more than the sector label.
Professional services (consulting, accounting, law firms) run 35 to 50 days, averaging around 40 to 45. Project billing and personal client relationships keep terms moderate, though they still lean toward the high end. The best firms get under 30 days by invoicing fast and setting explicit terms up front, which proves the point: that's an operational win, not a structural gift.
What ties these fast collectors together? Direct billing relationships, short approval chains, and no third-party payer or retainage clause standing between the invoice and the cash. Those are the conditions where effort actually pays off.
The mid-range sectors where operational choices start to matter
Tech and SaaS companies typically run 30 to 45 days, though enterprise deals can drag that out to 60 or 90-plus. Monthly recurring billing and standard Net 30-45 enterprise contracts set the baseline. Get customers onto annual prepayment, and DSO can drop 40 to 60%, which is a pricing decision as much as a collections one. Industry data shows cloud and IT infrastructure SaaS companies averaging 50 days versus 59 for services companies in the same space, and the spread within B2B SaaS itself is telling: median sits at 59 days, but the top quartile collects in 38. That 21-day gap isn't structural. It's just better execution.
Distribution and wholesale usually land at 30 to 50 days, with strong performers under 30. Supply chain complexity and a few big accounts push some numbers up, but the structural floor here is lower than in manufacturing, so consistent follow-up and clear terms genuinely move the needle.
Manufacturing runs 45 to 60 days in normal conditions, though 2025 tariff disruptions pushed a lot of accounts into 60 to 75. Long production cycles and milestone-tied invoicing build in delay. Strong performers target under 45 days by triggering invoices early and staying on top of milestone sign-offs, but external shocks like tariffs show how a whole sector's floor can shift upward regardless of how good anyone's AR team is.
Healthcare and pharmaceuticals: when the payer, not the customer, controls the clock
Healthcare benchmarks in 2025 range from 45 to 70 days, and the reason has nothing to do with patients dragging their feet. Insurance claim processing alone eats 30 to 60 days. Add prior authorization requirements (another 10 to 20 days) and a denial rate that forces resubmission on 5 to 15% of claims, and you've built a structurally slow system before anyone even opens a collections call. Healthcare DSO held around 45 days in 2021 and 2022; the wider 45-to-70 range now reflects both payer complexity and a lingering post-pandemic backlog. Even within healthcare there's a big split: top dental DSO networks collect in 20 to 28 days, while specialty practices run 40 to 50, mostly down to payer mix and how good their billing systems are.
Pharma and life sciences run even longer. PwC benchmarking data (from a 2021 study) put the median at 78 days, with top performers at 109 and the lowest performers at 54. Read that twice, because it's backwards from what you'd expect: the best-run companies have the highest DSO. That's because the biggest, most sophisticated players are the ones who can afford to extend terms to large distributors and government buyers. More recent numbers (Hackett and CFO.com's 2024 analysis) show pharma actually pulled DSO down from 74 to 70 days, helped by stronger product demand and more companies using factoring programs.
In both sectors, the lever that actually works isn't chasing the customer. It's denial management, documentation, and knowing your way around a payer portal.
Construction: why the highest DSO in any major sector is largely non-negotiable
Construction averages 80 to 90 days, which means invoices are aging well past the point most industries would start escalating before anyone in construction even blinks. Three things drive it. Progress billing means an invoice can't go out until the work is certified complete. Retainage holds back 5 to 10% of contract value until the project wraps, so final payment can land 90 to 120 days after the last invoice went out. And the approval chain runs deep: subcontractors wait on general contractors, general contractors wait on owners, and owners sometimes wait on lenders.
The spread inside construction is enormous. Residential remodelers post 30 to 45 day DSO. Commercial general contractors post 75 to 95. Same industry code, completely different reality, which is why a construction finance leader should be checking their number against sub-sector peers, not the industry-wide average. An 80-day commercial GC might be doing everything right. An 80-day residential remodeler has a problem.
In this world, AR management looks less like collections and more like paperwork triage: lien waivers, certified payrolls, compliance submittals, portal logins. Nobody's calling to beg for payment. They're chasing a document that's holding the payment hostage.
How to read your own DSO against a sector benchmark
First, make sure you're comparing yourself to the right group. Sub-sector beats broad industry code every time, residential versus commercial construction, cloud SaaS versus services SaaS, heavy government payer mix versus mostly commercial insurance. These distinctions change the honest answer.
Second, split your number into two pieces: the structural floor and the operational gap. The floor is the DSO you'd get even with flawless execution, set by contract terms and payer type; it's not something collections effort can touch. The gap is the space between your actual number and the top quartile in your sector, and that gap is where your AR team earns its keep.
Third, ask what your average is hiding. A single blended DSO can mask a handful of large, badly aged accounts sitting behind an otherwise healthy number, so aging buckets tell you more than the headline figure ever will. Atradius's 2025 U.S. data found 43% of credit-based B2B sales in the U.S. are overdue at any given time, and around 4% of B2B invoices eventually get written off as bad debt entirely, a tail worth tracking on its own.
Fourth, set a target you can actually hit. Aim for top-quartile performance in your own sector, not the global average. B2B SaaS again is the clean example: top quartile collects in 38 days against a 59-day median. That 21-day gap is the real ceiling for improvement, not zero.
The operational blockers that explain the gap between benchmark and actual performance
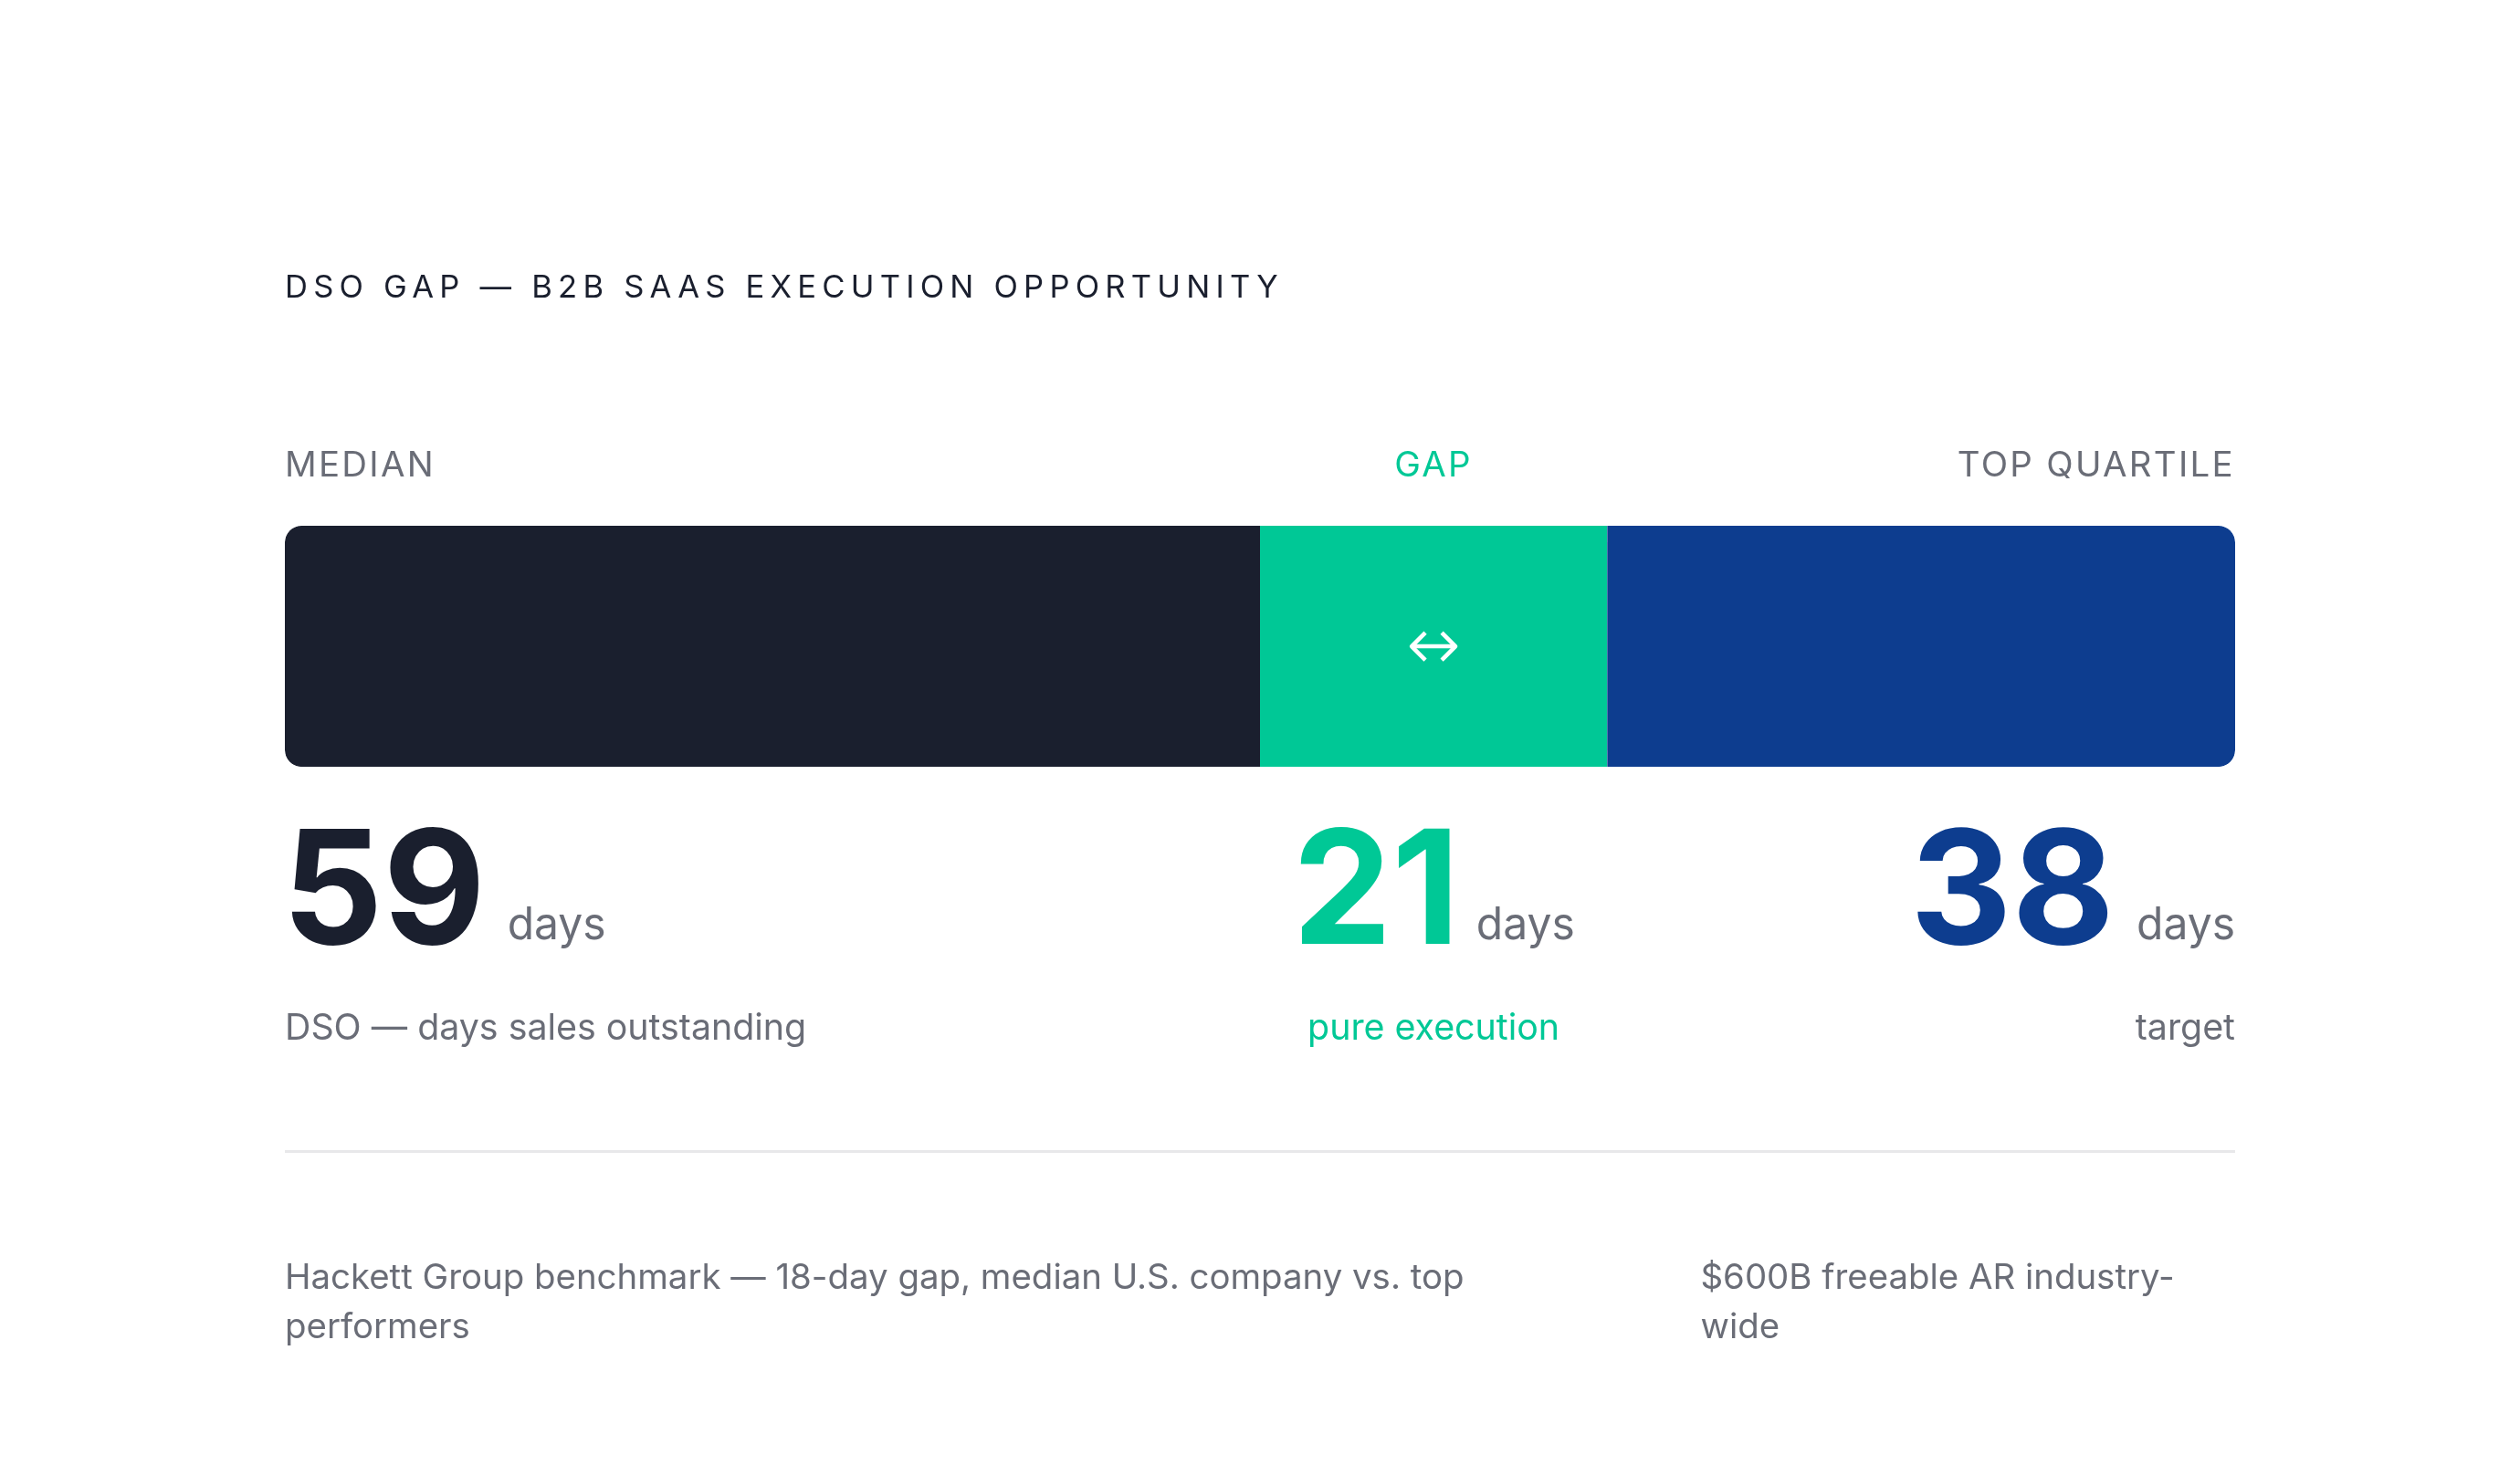
The Hackett Group's 2025 numbers put an 18-day DSO gap between top performers and the median U.S. company, worth roughly $600 billion in AR that could be freed up. That's the size of the prize sitting behind operational fixes.
Where does the delay actually live? Mostly in paperwork nobody's chasing hard enough. Missing W-9s, expired insurance certificates, unsigned lien waivers, a missing purchase order number, all of these leave invoices stuck in limbo that has nothing to do with whether the customer wants to pay. Supplier portals add another layer of friction: platforms like Coupa and Ariba require registration, specific invoice formatting, and ongoing status checks, and most AR teams simply aren't staffed to babysit that consistently. Then there's the quieter failure mode: invoices that land in a general inbox, reach the wrong contact, or lack the reference number the customer's system needs to process them. Nobody flags it as stuck. It just sits.
Timing makes it worse. A lot of teams follow up late in the aging cycle, after the invoice has already missed the customer's scheduled payment run, which means the wait just got a full cycle longer.
J.P. Morgan's 2024 analysis found roughly two-thirds of S&P 1500 companies reported a longer DSO than the year before, which tells you these aren't isolated hiccups. They're a pattern in how AR departments get resourced. And automation alone doesn't fix it: portal navigation, tracking down a missing document, resolving a dispute, these need a person paying attention and adapting, not a rule-based system running the same script on every invoice.
What closing the gap between your DSO and your sector benchmark actually takes
Closing the gap starts with knowing which part of your DSO is fixed and which part is fair game, then putting resources against the fair-game part instead of treating the whole number as one big collections problem. That means separating structural floor from operational drag, benchmarking against the right sub-sector peers instead of a generic industry average, and looking at aging buckets instead of one blended figure that hides where the real trouble sits.
From there, it's about fixing the plumbing: getting documentation right before the invoice goes out, staying on top of supplier portals instead of letting them become a black hole, making sure invoices reach a real person with the right reference numbers attached, and following up early in the aging cycle instead of after the customer's payment run has already come and gone. None of this is glamorous. Most of it is closer to admin discipline than finance strategy.
But the payoff is real and it's sitting in plain sight: the difference between median and top-quartile performance in your sector, multiplied across your receivables book. That's not a hypothetical number. It's cash that's already yours, just running late.