Bad Debt Prevention Through Proactive AR Management
Early intervention on overdue invoices cuts bad debt write-offs by up to 50%.
Bad debt doesn't show up out of nowhere. It builds, one skipped follow-up at a time, until the invoice you sent in March is the write-off you're explaining in September. This piece is about that build-up: where it starts, why it accelerates, and which specific habits actually stop it before it turns into a number on a bad debt schedule.
The pattern is almost boring in how repeatable it is. Invoice goes out, and nobody looks at it for a while. Eventually someone sends a late reminder, and it joins the aging report. Then, months later, someone writes it off and calls it a cost of doing business. Every single step in that chain had a moment where a different action would've changed the outcome. Roughly 44% of B2B invoices in the US are currently overdue at any given time, and 1 to 3% of that eventually gets written off as bad debt. That's not a rare event happening to unlucky companies. That's structural, baked into how most AR teams operate.
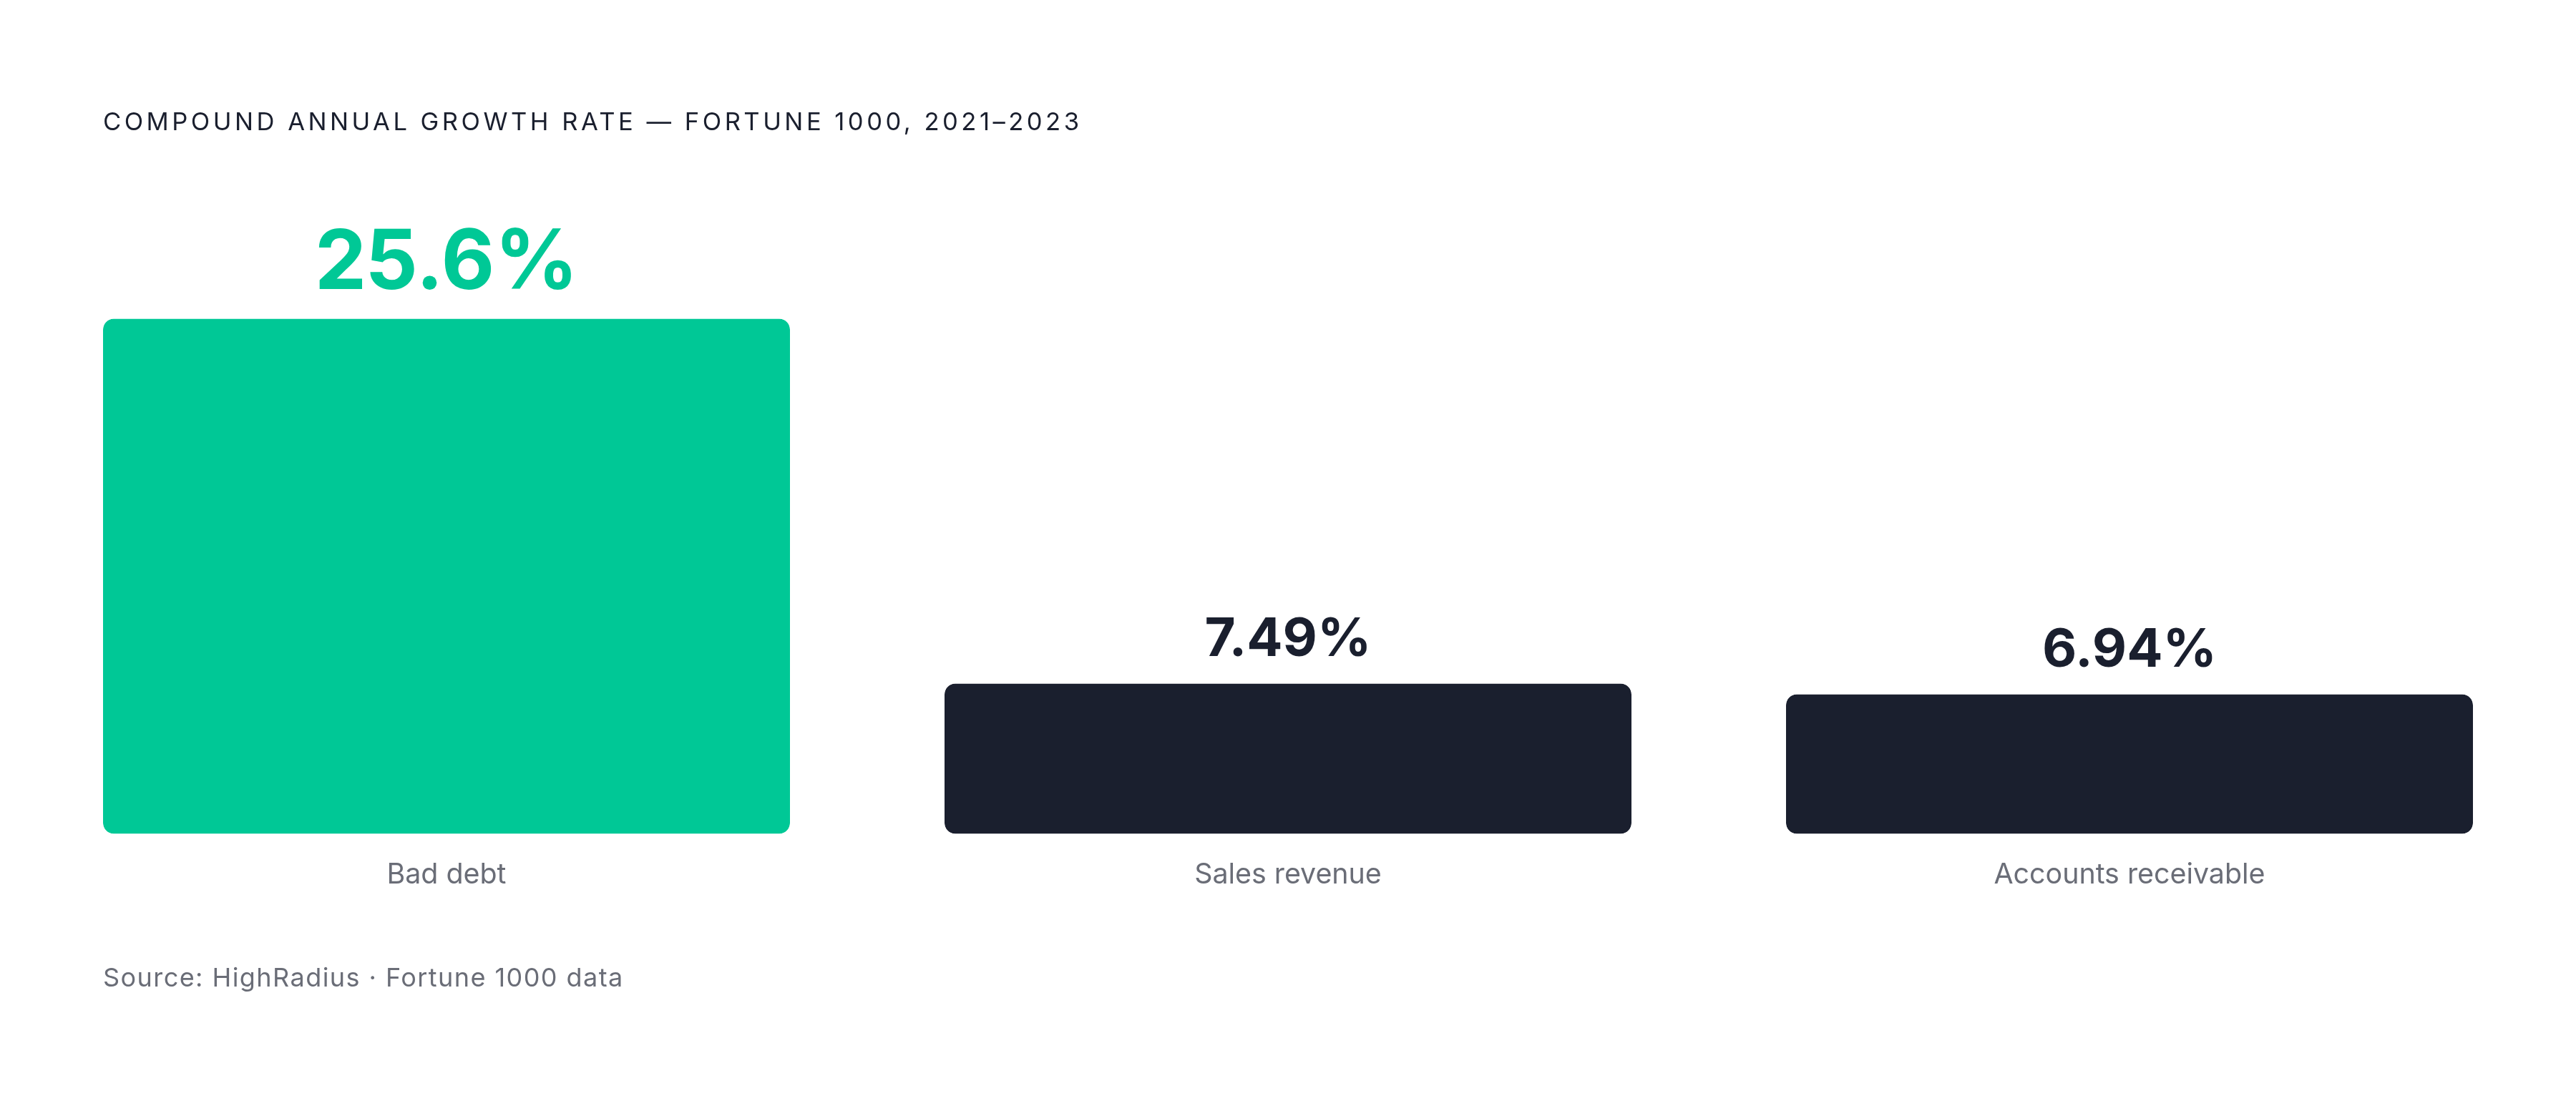
And it's getting worse faster than the business around it is growing. Fortune 1000 data from HighRadius shows bad debt growing at a 25.6% compound annual rate between 2021 and 2023, while sales revenue grew 7.49% and AR grew 6.94% over the same stretch. Sit with that gap for a second: bad debt isn't just scaling alongside the business, it's outrunning it by a wide margin. And the fallout isn't only about lost cash. Finance leaders report that rising write-offs are already messing with their ability to forecast (42% say so), which means the damage shows up twice: once in the receivables you'll never collect, and again in every planning model built on numbers that turned out to be wishful.
What the numbers say about which companies actually avoid write-offs
The scorekeeping metric here is bad debt-to-sales ratio: how much of your revenue evaporates into uncollectable receivables every year. It's a clean number, and it separates companies fast.
In the Fortune 1000 dataset, top performers (the 75th percentile) kept that ratio at 0.1% or lower. Bottom performers (25th percentile) ran at 0.57% or worse. The average sat at 1.49%. Do the math on that spread and you get something like a fivefold difference between companies that manage this well and companies that don't. That's not a rounding error. That's the difference between a healthy AR function and one quietly bleeding revenue every quarter.
Context matters, too. Most B2B sectors treat a 1 to 3% write-off rate as normal, while construction and healthcare run hotter, often 3 to 5%, and government contracting and utilities usually stay under 1%. Healthcare deserves its own footnote here: bad debt-to-sales averaged 5.15% in 2023, with some segments climbing as high as 55.49%. That's not sloppy AR work, that's payer complexity doing what payer complexity does. Worth naming so nobody in healthcare finance reads this and panics about numbers that are structurally different from a typical B2B business.
Here's the part that actually matters for anyone trying to fix this: the single biggest predictor of lower bad debt isn't headcount or fancy software. Federal Reserve data shows businesses with formal credit policies write off 30 to 50% less bad debt than businesses without one. That's a process gap, not a fate gap. It means the five-times difference between top and bottom performers is mostly a documentation problem, and documentation problems are, thankfully, solvable.
Why DSO is the leading indicator that bad debt is forming
Bad debt is what happens after the fact. Days Sales Outstanding (DSO) is the warning shot, and by the time a write-off actually lands on the books, DSO had usually been drifting upward for weeks, sometimes months, with nobody watching closely enough to notice.
Industry data put the median DSO across B2B industries at 56 days, with about 70% of companies running past 46 days. But averages hide a lot. Construction sits at 83 days. Oil and gas, 65. Manufacturing, 58. Legal, 55. Healthcare, 52. Wholesale, 48. Transportation, 45. Professional services, 42. Education, 38. SaaS comes in leanest at 35.
Here's why this isn't just a spreadsheet curiosity: on a $50 million revenue base, every single day of DSO represents roughly $137,000 sitting in receivables instead of in the bank. Shave DSO from 55 days down to 45, and you free up about $1.4 million in cash, cash that would otherwise need to be borrowed against a revolver at 8 to 10% interest. That's not abstract efficiency. That's real interest expense you avoid paying.
It's why 71% of mid-market CFOs, per a 2024 PYMNTS survey, now treat DSO as a core liquidity input rather than some back-office metric nobody outside accounting looks at. And there's a cyclical wrinkle worth flagging: recessions push DSO up 15 to 25% across industries generally, with some B2B sectors seeing swings of 20 to 35%, and it typically takes 12 to 18 months to claw back to the pre-recession baseline. So this isn't just a "watch it in good times" metric. It's the thing that gets worse fastest when the economy turns.
A few practical tripwires worth setting: DSO running 50% past your standard terms, more than 20% of AR sitting past 60 days, or (at the sector level) a meaningful chunk of receivables aging past 91 days, which is exactly what showed up across a notable number of US industry segments in early 2025. Any of those should trigger a real conversation, not a shrug.
The aging curve: how quickly recovery probability falls once an invoice is overdue
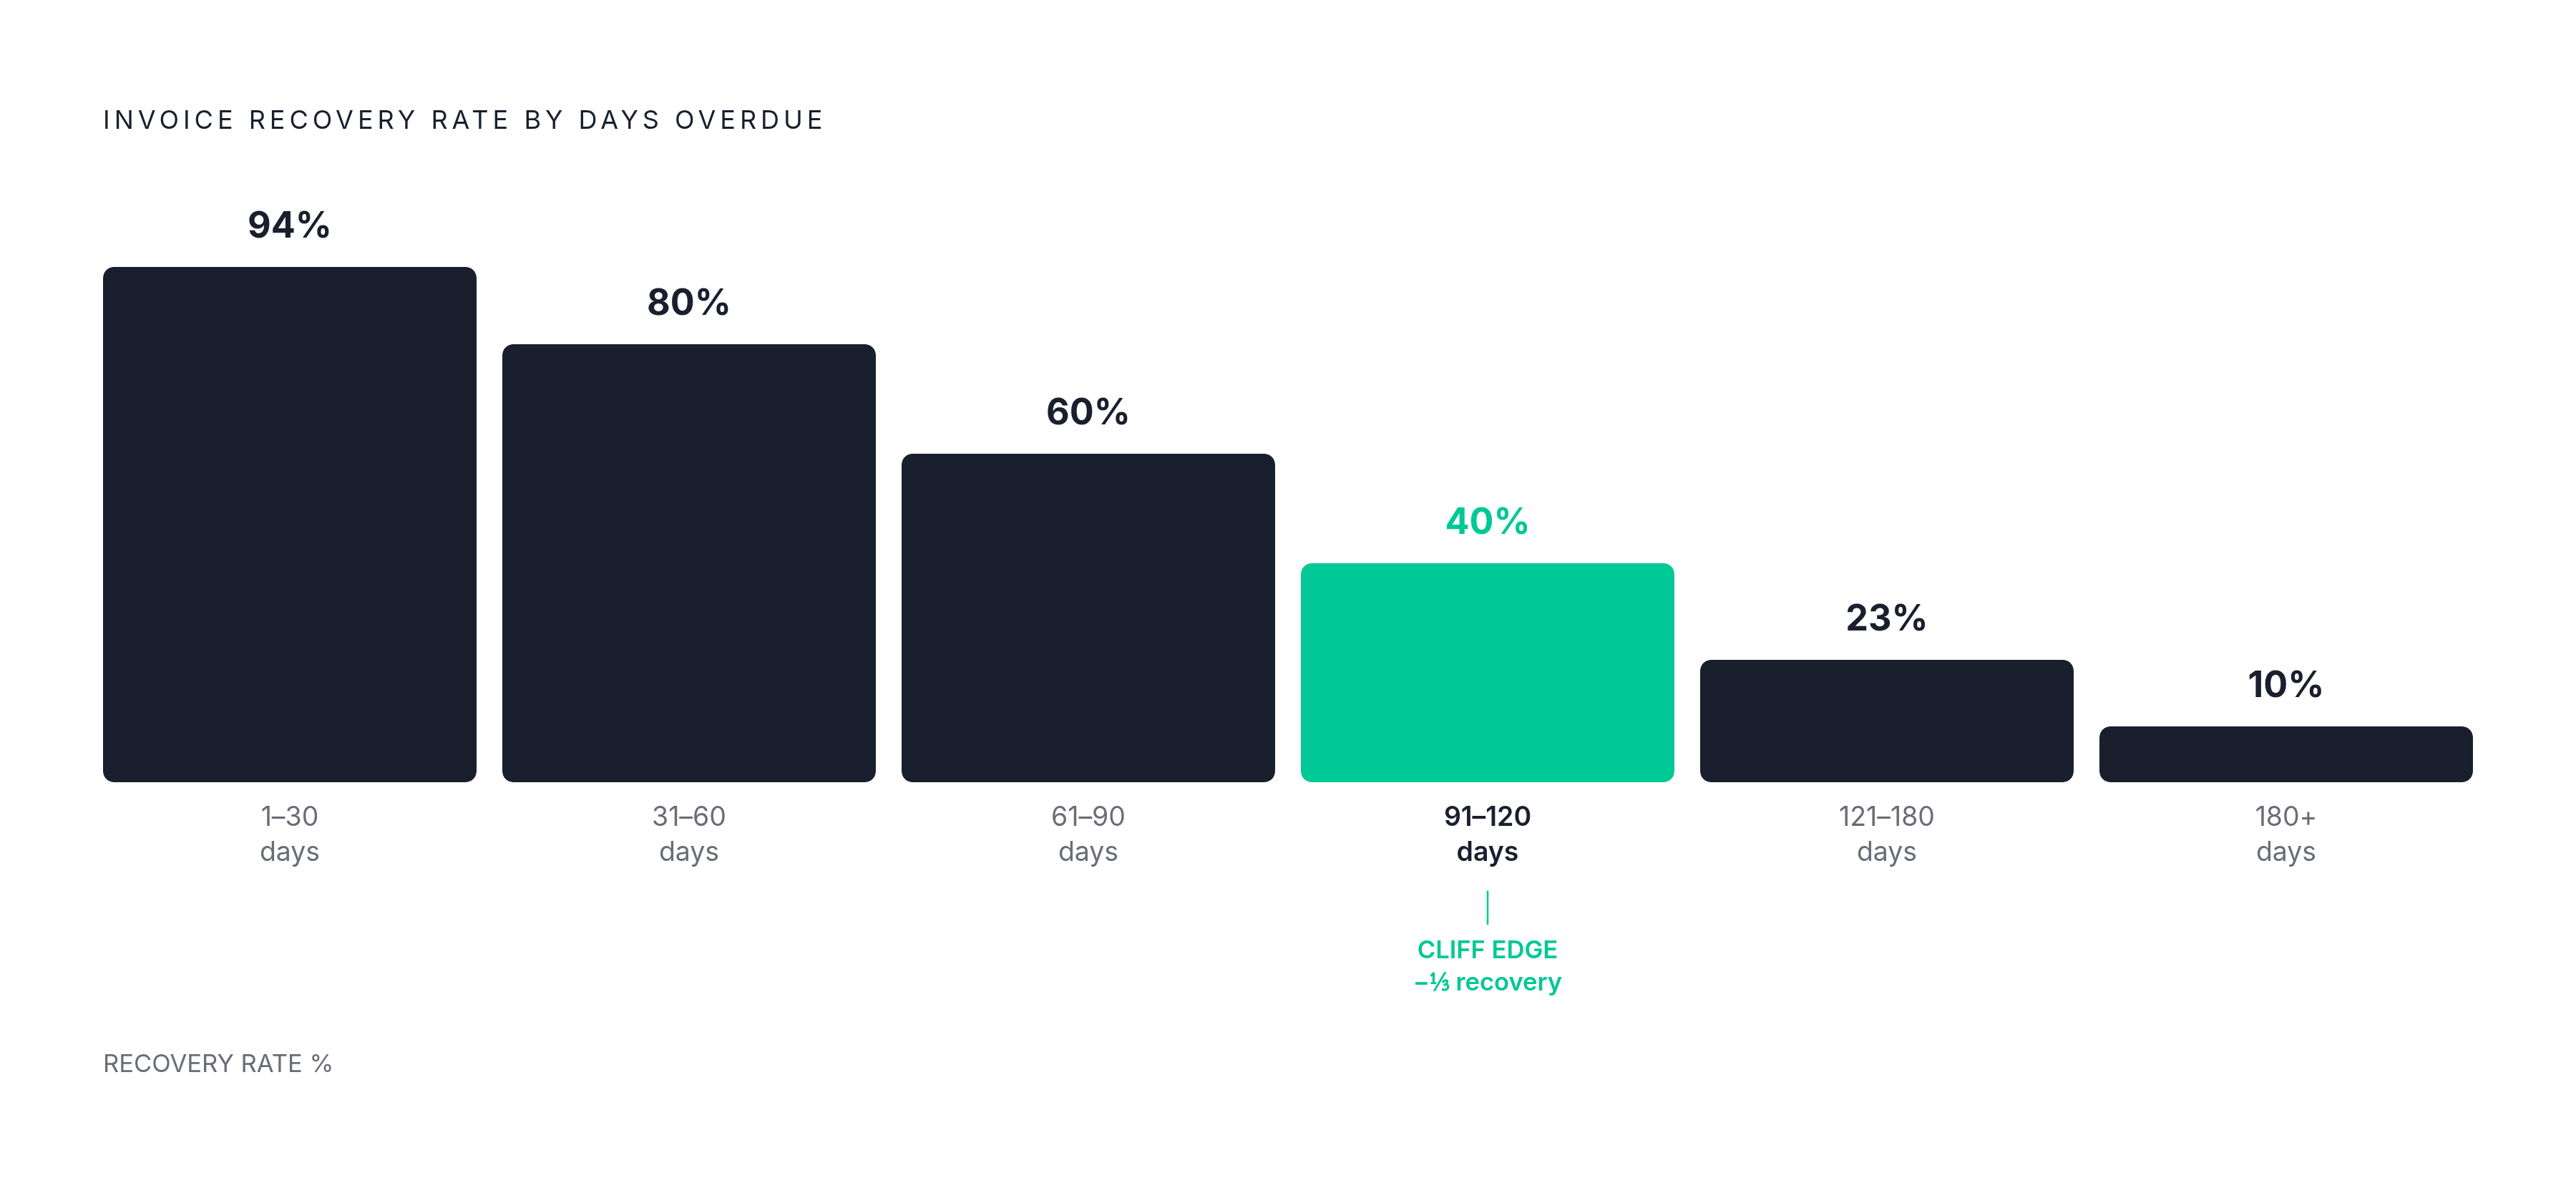
Recovery probability doesn't slide downhill gradually. It falls off a cliff, and the cliff shows up faster than most people expect.
Data compiled from collections and credit industry sources (CLLA, ACA International, Atradius, PwC) shows the shape clearly. Invoices overdue 1 to 30 days recover at a 90 to 98% clip, which is basically still money in the bank. At 31 to 60 days, that drops to 75 to 85%. By 61 to 90 days, you're down to 50 to 70%, which is already a coin toss dressed up as a business decision. Push past 90 days into the 91 to 120 day range and recovery falls to 30 to 50%. From there it keeps eroding: 15 to 30% at 121 to 180 days, then 5 to 15% once you're past six months.
The jump between 90 days and just past that mark is brutal. Write-off exposure roughly doubles in the space of a single quarter of doing nothing. Research from Eagle Rock CFO puts a finer point on it: every week you sit on an overdue invoice without action costs you roughly 1% of expected recovery. That adds up fast, and it adds up quietly, which is exactly why it sneaks past people.
An invoice sitting at 90 days isn't "still collectable, just running late." It's a coin-flip wearing a suit. And this is directional, not just a statistics exercise: a company that follows up consistently at 15, 30, and 45 days will out-recover a company that waits until day 90 to start making phone calls, every time, regardless of how aggressive those calls eventually get.
Construction is the case study nobody asked for but everybody in that industry lives with. An 83-day median DSO means a lot of invoices are already crossing into the 61 to 90 day bucket before anyone's sent a single follow-up. The risk isn't a surprise there. It's baked into the industry's own norms.
Knowing the cliff exists doesn't move you off it, though. The rest of this piece is about the specific habits that keep invoices from ever getting close to the edge.
Getting credit decisions right before the first invoice goes out
Most bad debt doesn't start in collections. It starts at onboarding, when a credit limit gets set by gut feel, or by sales pressure to just get the deal done, instead of by actual data.
This isn't always negligence. It's often bandwidth. A third of organizations, per NACM survey data, say they're pressed for time to do proper due diligence on new customers before extending credit. Everyone's stretched thin, and credit checks lose out to whatever's on fire that week.
When credit managers do have time, the sources they lean on are fairly consistent: roughly half point to credit bureau reports as the most important input, trade references come in around 26%, and financial statements sit at 18%. Reasonable stack. The problem is what happens after that initial check. Gartner data suggests business credit information decays at roughly 70% per year, meaning a credit decision made twelve months ago is standing on information that's mostly stale by now. Annual reviews just aren't enough for active accounts, especially when conditions shift.
This is where static credit limits start showing their age. A static limit gets set once at onboarding and doesn't get revisited until something's already gone wrong; a dynamic model updates as new payment behavior and bureau data roll in, which shortens the gap between a customer's finances deteriorating and your company actually noticing. Good onboarding produces three concrete things: a credit limit that matches reality, payment terms written down instead of assumed, and escalation thresholds agreed on before anyone's chasing a late payment. Because here's the uncomfortable truth: a customer handed a credit limit they can't actually service is a future write-off. The bad debt didn't happen in collections. It got authorized on day one.
Catching customer risk changes between the first sale and the final invoice
Onboarding sets the baseline. What happens after that is where most of the actual risk hides, and it's why ongoing monitoring matters just as much as the initial credit check.
The warning signs usually show up before a payment is ever late: slower payments, partial payments where full payment used to be routine, order volumes shifting, a bureau downgrade, a negative filing showing up somewhere public. Real-time monitoring means keeping an eye on credit bureau updates, public filings, financial statement changes, and internal payment history, so any one of those can trip a flag before a missed invoice does the flagging for you.
The value here is lopsided in a good way. Catch a customer showing early stress and you've got options: tighten terms, trim exposure, start a conversation early. Wait until the payment's already missed and most of those options are gone. Tie this back to the aging curve and the logic gets obvious. An account flagged early gets managed inside that 1 to 30 day window where recovery is still 90 to 98%. The same account, discovered only once it's 90 days overdue, is a coin-flip.
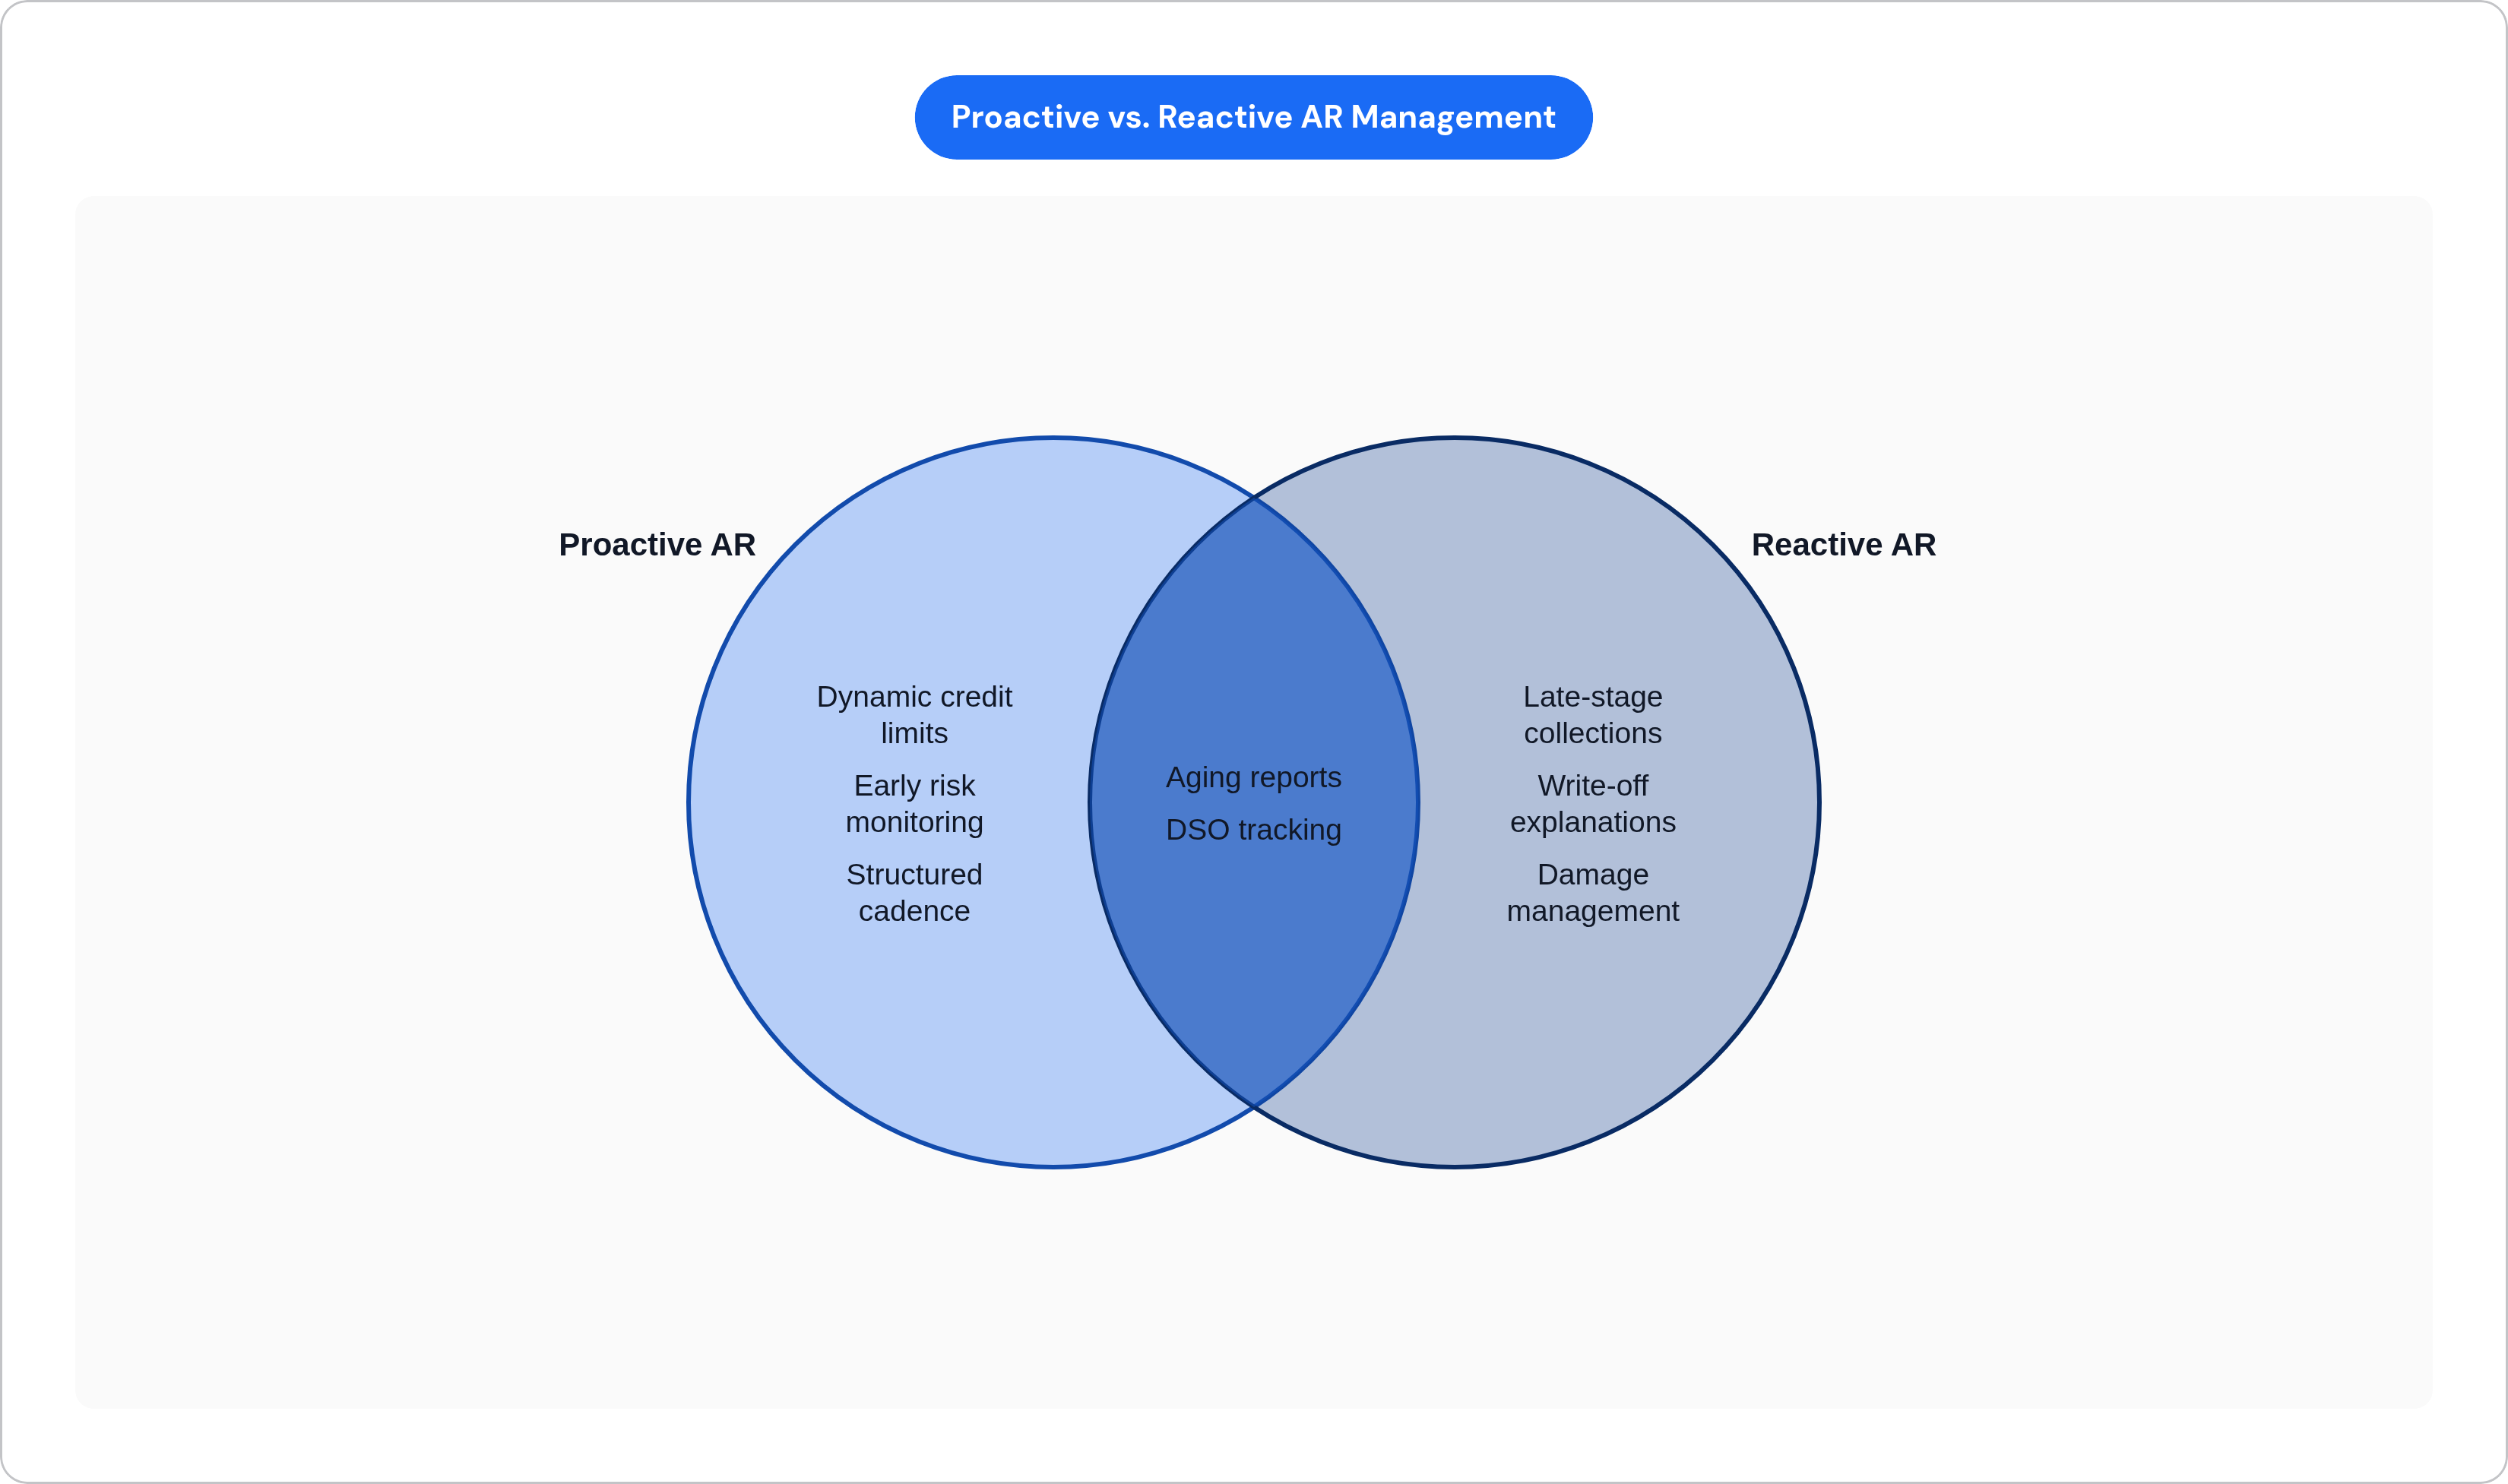
A few concrete triggers worth watching for: a reliable customer suddenly paying 10 to 15 days later than usual for two cycles running, partial payments landing on invoices that used to get paid in full, or a customer's order frequency quietly dropping off (going quiet is often a financial signal wearing a disguise). This is the actual line between reactive and proactive AR. Reactive AR has no mechanism to see any of this until the payment's already late, at which point you're not managing risk anymore, you're managing damage.
What a structured collections cadence actually looks like in practice
Most companies don't fail to follow up. They fail to follow up consistently. The invoice gets a reminder eventually, but "eventually" is doing a lot of work in that sentence, and it usually only happens once someone happens to notice the account looks bad.
A tiered approach fixes that. At 1 to 30 days overdue, the cause is usually mundane: a clerical error, a missing document, portal friction. The right move is a friendly, process-focused nudge, not a demand letter. At 31 to 60 days, it's time for a direct inquiry: what's actually blocking payment, and can we confirm the invoice was received and is accurate. By 61 to 90 days you're in genuinely risky territory, recovery odds are already declining, and this is where you escalate to a senior contact or consider putting the account on hold. Past 90 days, you're in critical territory, and it usually takes specialized internal attention or a third party to move the needle.
Eagle Rock CFO benchmarks show that companies putting account holds in place at 60 to 75 days past due see meaningfully faster resolution from their chronic late payers. Segmentation matters too. Not every customer deserves the same tone or the same escalation speed; payment history and account size should shape how hard and how fast you push.
Then there's the unglamorous stuff, the reasons invoices stall that have nothing to do with the customer being unwilling to pay:
- Missing W-9s or other compliance paperwork sitting in someone's inbox
- Invoices stuck inside supplier portals (Coupa, Ariba, and the like) waiting on manual approval steps
- Disputed line items nobody's formally resolved, just left hanging
- Invoices routed to a contact who left the company or no longer approves payments
These aren't rare edge cases. They're some of the most common reasons an invoice crosses 30 days, and a reminder email does nothing to fix a document that's missing or a portal that's jammed. They need someone to actually go resolve them. And the cadence only works if it's actually run, every time, on every account. An AR team following up on 80% of accounts 80% of the time has a real gap, and the aging curve will find it eventually.
How invoice quality and delivery speed affect whether an invoice gets paid on time
A lot of late payments have nothing to do with the customer's willingness to pay. The invoice itself was the problem, and nobody noticed until it was already 45 days old.
The usual suspects: wrong amounts, missing PO numbers, the wrong billing entity listed, formatting nobody's system can read cleanly, or the invoice landing in an inbox that belongs to someone who left the company two quarters ago. Electronic invoices, by contrast, arrive in under 24 hours and get processed faster with fewer disputes than paper ever did; companies making that switch have documented DSO improvements in the range of 6 to 10 days, which is a meaningful chunk of the cash math discussed earlier.
Automated reminders, sent by email or text on a set schedule, genuinely improve on-time payment rates. Not because they're aggressive, but because they're predictable. Customers can plan around a reminder they know is coming; they can't plan around silence followed by a surprise phone call. A quick pre-send checklist catches most of the damage before it happens: confirm the billing contact is current, make sure the PO number is present and matches what's in the customer's own system, and spell out payment terms explicitly instead of assuming everyone remembers what was agreed six months ago. An invoice that arrives clean, addressed to the right person, formatted for the right system, with terms stated plainly, removes every excuse for delay before the payment clock even starts.
Worth considering for your higher-volume accounts: early payment incentives, something like a 2/10 net 30 structure, which pulls cash in faster from customers who have the liquidity to take the discount and just needed a reason to move first.
Where AI and automation change the economics of proactive AR — and where they fall short
Automation's real contribution here is simple: it removes the human bandwidth problem that causes half the failures described above. A person managing 400 accounts is never going to catch a customer paying 12 days later than usual for the second cycle in a row. A system watching payment patterns across every account, every day, will catch it without blinking, and it'll flag it before the invoice ever reaches the danger zone on the aging curve.
That's the honest upside. Automated cadences don't skip steps because someone's on vacation or the quarter got busy. Monitoring tools can watch bureau data and payment behavior continuously instead of once a year. Reminder sequences fire on schedule, every time, without needing a person to remember to hit send.
Where it falls short is just as real. Automation can flag that a customer's paying slower; it can't have the actual conversation about why, or read the tone of a client who's stressed but still good for the money versus one who's quietly circling the drain. Disputed line items, missing documents, a contact who's ghosting because they got laid off: those need a human picking up the phone or reading between the lines, not a workflow rule. The judgment calls at 61 to 90 days, when you're deciding whether to escalate to a senior contact or put a hold on the account, still belong to a person who knows the relationship.
The honest way to frame it: automation buys back the time and consistency that reactive AR teams never had, which closes most of the gaps described in this piece. It doesn't replace the credit policy, the escalation judgment, or the conversation that actually gets a stalled invoice unstuck. It just makes sure someone's paying attention long enough for a human to have that conversation before the account slides past day 90 and the odds turn against you.