Key Metrics for Accounts Receivable Performance
Understanding which AR metric matters depends on where your cash is actually stuck in the pipeline.

AR metrics aren't a report card. They're a map. Each one points to a different stage of the invoice-to-cash journey, which means each one points to a different type of problem. That distinction matters more than most finance teams realize, because the instinct when cash is slow is to look at one number and pull one lever. That's rarely how it works.
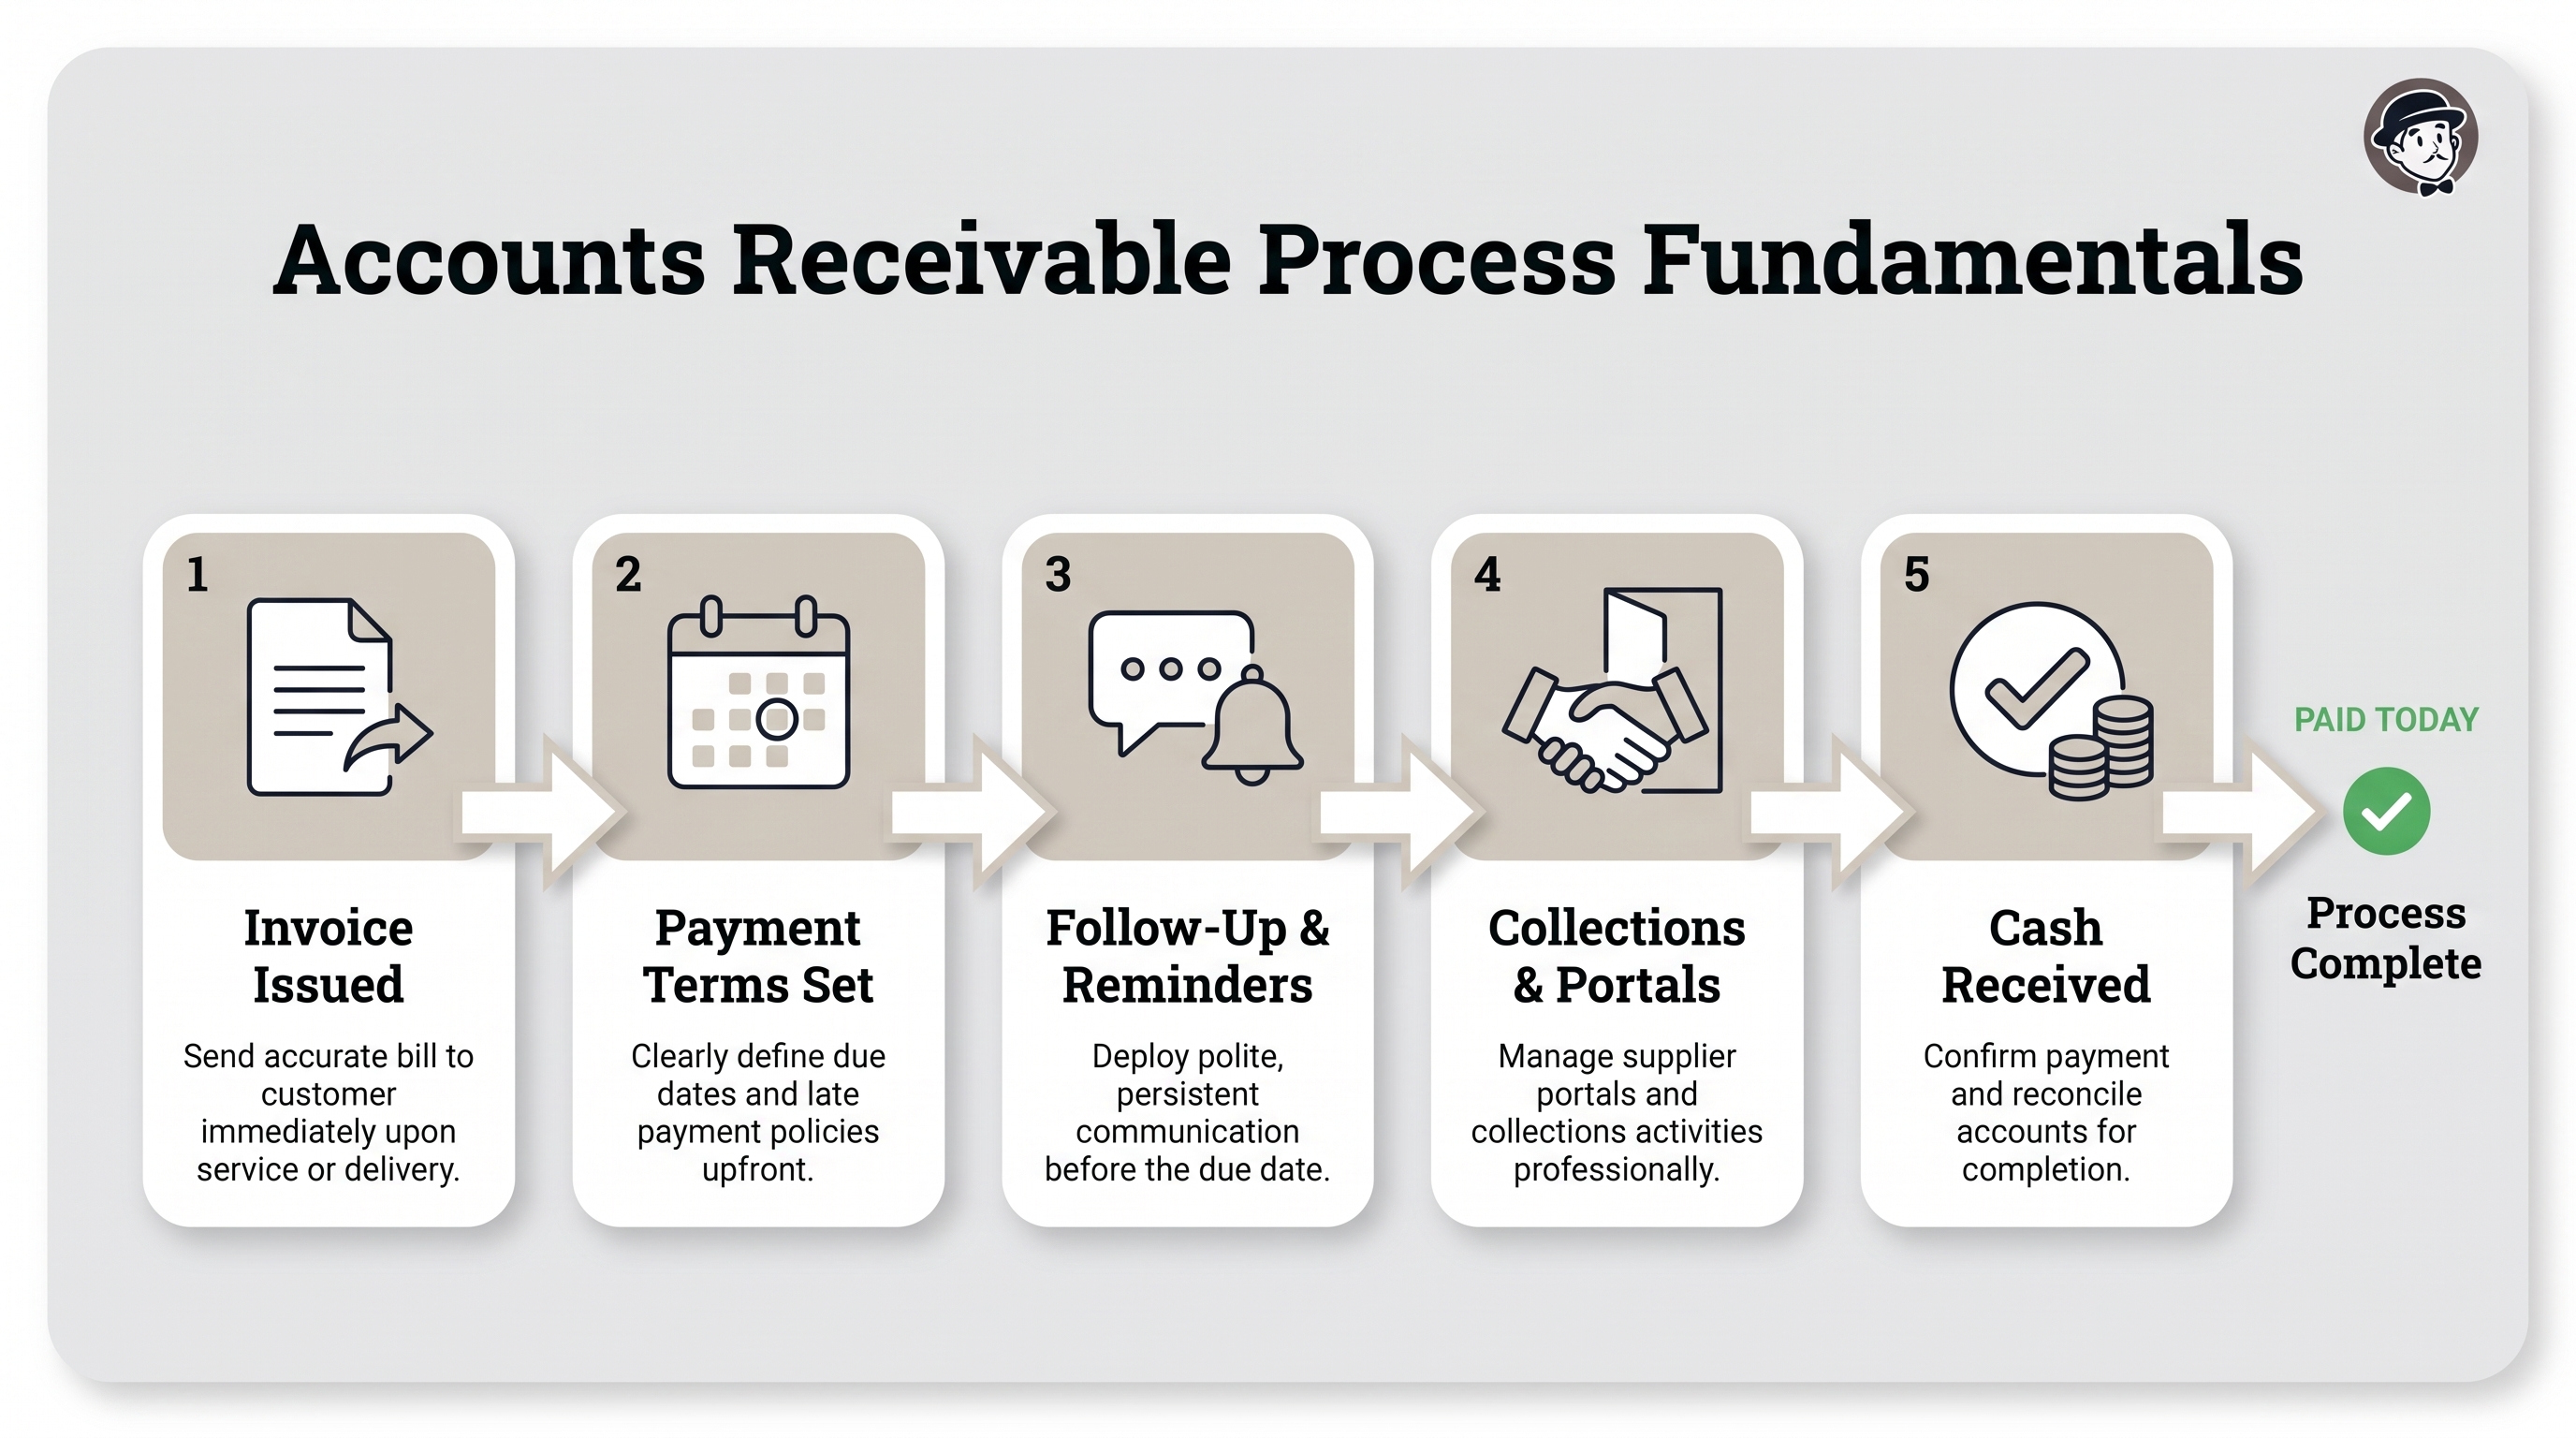
Think of it as a pipeline. A sale gets made, an invoice goes out, cash is supposed to come back in. Simple enough. But that pipeline has stages, and blockages don't always show up where you'd expect. The water stops flowing three feet from the drain. The clog is somewhere else entirely.
The metrics roughly break into three groups:
- Performance measures (DSO and ADD): How long is cash taking to come in, and how much of that wait is actually your fault?
- Process measures (CEI and AR turnover): Is the collections function keeping pace, or are invoices quietly piling up somewhere?
- Risk and friction measures (bad debt ratio, aging, match rate, invoice accuracy): What's genuinely at risk of never arriving, and what operational sloppiness is making everything look worse than it is?
No single metric tells the full story. A healthy DSO sitting alongside a deteriorating aging report, for example, can mask a growing pile of uncollected debt. The average looks fine. The problem is accumulating in the back of the queue. By the time DSO starts moving, you've already lost the window on a lot of it.
Industry context matters too. A "good" DSO in retail looks nothing like a "good" DSO in construction. APQC's benchmarking program covers more than a dozen sectors. Generic benchmarks are a starting point. Industry-segmented ones are what you actually need.
Days Sales Outstanding: The Headline Metric and What It Actually Tells You
DSO is the number everyone knows. That's both its strength and its limitation.
Formula: DSO = (Accounts Receivable ÷ Total Credit Sales) × Number of Days in Period.
On average, how many days does it take to turn a credit sale into collected cash? There are two ways to calculate it. The simple average is fast but gets distorted by seasonal swings. The countback method is more accurate when revenue is uneven. Which is, honestly, most businesses most of the time. If your revenue fluctuates month to month, use the countback.
Top performers, per The Hackett Group, collect within 28 days. The median sits around 46 days. That 18-day gap has real dollar value, and it compounds across a full year of revenue.
Industry ranges matter a lot here:
- Retail and restaurants: 10 to 30 days
- SaaS: 30 to 60 days
- Manufacturing: 45 to 75 days
- Construction: 60 to 90 days, sometimes more
A 50-day DSO at a SaaS company is a real problem. At a construction firm it means you're running ahead of schedule. Context is everything, and yet this is the step most benchmark conversations skip entirely.
One ratio that adds precision is the DSO Efficiency Ratio: actual DSO divided by average payment terms. A ratio of 1.0 to 1.15 means things are running well. Above 1.50, you have a compounding cash flow issue. This matters because companies that offer longer payment terms to win business will naturally show higher DSO. Not because collections is broken. Rather, someone upstream made a commercial call. The efficiency ratio separates those two things.
What DSO still won't tell you is where in the process the delay actually lives. The Hackett Group found receivables performance worsened for a second consecutive year in 2024, partly because buyers are deliberately stretching payment terms as their own working capital strategy. DSO picks that up as a collections problem. It isn't one. That's what the next metrics untangle.
Average Days Delinquent: Separating Unavoidable Delay From Fixable Lag
ADD is DSO's more honest sibling, and it doesn't get nearly enough airtime.
Formula: ADD = DSO minus Best Possible DSO (BPDSO), where BPDSO is the theoretical floor based on your current payment terms.
The gap between your actual DSO and that floor is what you're genuinely managing. Some of the wait is baked in. That's the deal you made with the customer. Everything past that floor reflects process friction, customer behavior, or preventable delay. ADD tells you which category you're actually fighting.
ADD averaged 6 days in 2025, up one day year over year. Separately, a survey of AR professionals found 60% reporting average days beyond terms of 16 to 50-plus days, against an industry benchmark of 19 days. The gap between typical and achievable is real, and it's significant for most organizations.
A few things worth knowing about how to track it:
- ADD naturally decreases as a period progresses because older invoices get resolved. Evaluate it quarterly. Monthly snapshots can be genuinely misleading.
- The aggregate hides where the lag actually lives. Segment ADD by customer, invoice size, or product line. Almost always, a small number of accounts are responsible for most of the delay.
Finance leaders who track only DSO never make the distinction between "the market is slow" and "we have a fixable process problem." Without that distinction, you apply pressure in the wrong places and wonder why nothing changes.
Collection Effectiveness Index: Measuring Whether the Collections Effort Is Actually Working
CEI is more technically precise than DSO, which is probably why nearly 40% of finance professionals don't track it. That's a significant gap given what it surfaces.
Formula: CEI = [(Beginning AR + Credit Sales − Ending Total AR) ÷ (Beginning AR + Credit Sales − Ending Current AR)] × 100.
Above 80% is strong. Close to 100% is excellent. Below 80% points to systemic inefficiency worth digging into.
The reason CEI matters so much is that DSO can hold perfectly steady while collections quality quietly erodes underneath. Current invoices are getting handled fine. Aged receivables accumulate in the background. The surface looks calm. The riverbed is silting up. You find out when the flow stops.
CEI pairs well with aging analysis. Together they answer the same question from two angles: is the collections function keeping up with new volume while also working through what's already overdue? If one looks good and the other doesn't, something specific is off, and the combination will point you toward what.
AR Turnover Ratio and Bad Debt Ratio: Measuring Asset Efficiency and the Cost of Not Collecting
These two sit at opposite ends of the same question. AR turnover tells you how efficiently you're cycling through receivables. Bad debt ratio tells you what it cost when that efficiency failed.
AR Turnover Ratio: Net Credit Sales ÷ Average Accounts Receivable. How many times is the average AR balance fully collected in a year? Higher is better. Seven to ten times annually is generally healthy, though your payment terms set the realistic ceiling.
Bad Debt Ratio: Receivables written off ÷ Total credit sales. The benchmark sits around 1.5%. Most companies land between 1.6 and 3%. Above 3%, you have a credit risk or collections failure that needs attention at the process level, rather than just the individual account level.
The urgency comes from how fast collectibility decays:
- At 3 months overdue: 26% probability of becoming uncollectible
- At 6 months: 70%
- At 12 months: 90% are permanent write-offs
Wait a year, and you're almost certainly writing it off. PYMNTS data from 2025 puts bad debts at roughly 6% of credit sales across North America. Four times the benchmark. Which means the average organization is absorbing a significant amount of preventable loss and probably not tracing it back to where the failure actually started.
Bad debt ratio is a trailing indicator. Chronic DSO and ADD problems don't announce themselves as write-offs right away. They show up there eventually, months after the window to intervene has mostly closed.
AR Aging Report: The Most Actionable Daily View of Where Cash Is Stuck
If CEI tells you whether collections is working, aging tells you what to do about it today. It's the most operationally immediate tool in the whole stack.
Aging buckets sort outstanding invoices by how long they've been overdue: 0 to 30 days, 31 to 60, 61 to 90, 90-plus. The distribution across those buckets tells you whether you have a volume problem (lots of slightly late invoices) or a tail problem (a growing pile of seriously old ones). Those two problems require completely different responses and it's worth slowing down to actually tell them apart before deciding what to do.
The single most risk-sensitive number in the aging report is AR over 90 days as a percentage of total outstanding. That's where the collectibility decay curve gets steep. Keep it below 15 to 20% of total AR. Above that, write-off risk becomes material.
Dun & Bradstreet's Q3 2025 US AR Industry Report found that 15 of 202 industry segments had 10% or more of their aging dollars sitting in the 91-plus day bucket. The heaviest concentration showed up in business and professional services, retail, transportation, and wholesale.
The real operational value is prioritization. A team that treats all overdue invoices the same will spend time chasing low-risk current invoices while high-risk aged receivables quietly cross the 6-month collectibility cliff. Work the 90-plus day bucket first, and work it hard.
Aging also surfaces customer-specific concentration that aggregate metrics completely miss. One large account sliding into the 60-plus day bucket can represent a disproportionate share of total exposure. DSO won't show you that. Aging shows you immediately.
Invoice Accuracy and Cash Application Match Rate: The Operational Metrics That Quietly Drive All the Others
These two metrics sit at opposite ends of the invoice-to-cash pipeline, and between them they explain a surprising amount of drag that shows up in DSO and CEI with no obvious cause. They're the ones that get ignored until someone finally asks why DSO is high when the customers aren't actually that slow.
Invoice accuracy rate is the percentage of invoices issued without errors. Billing mistakes trigger disputes. Disputes delay payment. That delay inflates DSO independent of anything the customer is doing. Electronic invoicing results in 73% faster processing and 85% fewer disputes compared to paper, with DSO dropping 6 to 10 days as a result. That's one of the clearest operational ROI cases in all of AR, and it requires no change to credit policy or collections headcount.
Cash application match rate is the percentage of payments applied automatically without manual intervention. This one is sneakier. When a customer pays and that payment sits unmatched in the bank, it doesn't register as collected in your AR system. The cash is there. Your metrics don't know it yet. So DSO, CEI, and aging all look worse than the underlying customer behavior actually warrants. You're staring at a gap that doesn't really exist.
Traditional targets run 85 to 95%. In 2025, Billtrust reported clients hitting 88 to 93%. More advanced platforms push close to 98%.
The uncomfortable part: 83% of firms have yet to fully automate their AR functions, per PYMNTS Intelligence data. Most organizations are absorbing the hidden costs of manual cash application and invoice errors in their metrics without ever identifying those as the source of the problem. They conclude their customers are slow payers. Sometimes that's genuinely not it.
How to Read the Metrics Together Rather Than in Isolation
Each metric is useful on its own. Used together, they function as a diagnostic system that points to specific root causes rather than just symptoms.
A few patterns that show up regularly in practice:
High DSO + High CEI. Customers are slow payers. Collections is doing its job against a difficult population. The problem is upstream: credit policy, payment terms, customer selection. Pushing harder on collections won't fix this.
High DSO + Low CEI. The collections function has real gaps. Follow-up is inconsistent, invoices are falling through the cracks, escalation isn't happening. This is an operational fix, not a credit policy conversation.
Healthy DSO + Growing 90-plus Day Aging. This is the quiet one. Easy accounts are getting collected quickly. A difficult minority is building up in the tail. The aging report and bad debt ratio will deteriorate well before DSO ever signals a problem. By the time DSO moves, a lot of that tail has already crossed the collectibility cliff.
Good Match Rate + High ADD. The delay is upstream of payment application. It's sitting in customer behavior, communication gaps, portal friction, or missing documentation. Operations is working fine. The front-end relationship and follow-up process is where the problem lives.
US small businesses collectively hold $825 billion in unpaid invoices, roughly 3% of GDP. That's not a measurement problem. It's an execution gap. The metrics help you figure out exactly where that gap is. Which is the only way to actually close it.
The goal isn't to watch all of these simultaneously and panic when something moves. It's to use them in combination, make the right call at the right stage, and stop applying uniform pressure across invoices that have very different risk profiles.
Setting Benchmarks That Are Actually Useful for a Specific Business
Generic targets are starting points, not verdicts. DSO under 45, CEI above 80%, bad debt under 1.5% — useful orientation, but they can mislead as easily as they inform if you grab them without context.
A construction company at 75-day DSO is outperforming its peers. A SaaS company at 60-day DSO has a real problem. The number without context is nearly useless, and yet that's how most benchmark conversations go: someone pulls a number from an industry article and starts measuring against it.
APQC's Open Standards Benchmarking program provides industry-segmented AR benchmarks across aerospace, manufacturing, healthcare, retail, wholesale distribution, and more. Benchmark within your sector. Comparing a construction firm to an all-industry average is how you spend months either stressed about numbers that are perfectly normal for your market, or reassured by numbers that are quietly terrible.
Three-tier benchmarking is more useful than chasing a single number:
- Top quartile: best-in-class for your sector, the realistic ceiling for strong performance
- Median: what's typical, useful for knowing whether you're above or below the pack
- Internal trend: is performance improving or deteriorating quarter over quarter?
That third one is the most underweighted. In 2024, 67% of S&P 1500 companies reported longer DSO than the prior year, per J.P. Morgan data. A company that held DSO flat in that environment actually improved on a relative basis, even if the absolute number looks the same. Trend tells you what's happening inside your operation. External comparisons tell you where you stand. You need both, and neither one alone gives you the full picture.
For teams building an AR metrics program from scratch, a reasonable sequence:
- Start with DSO, ADD, CEI, and 90-plus day aging. Primary diagnostics.
- Add match rate and invoice accuracy once the primary metrics are stable. These surface the operational drag that distorts the primary numbers.
- Set industry-calibrated targets before making operational changes. Otherwise you optimize toward the wrong number and wonder why performance doesn't improve.
The metrics themselves are not complicated. Reading them together consistently, and acting on the right problem at the right stage, is where most organizations haven't gotten yet. The ones that do tend to find a lot of cash they didn't realize they were losing.