Accounts Payable vs Accounts Receivable
One company's payment obligation is another's uncollected revenue.
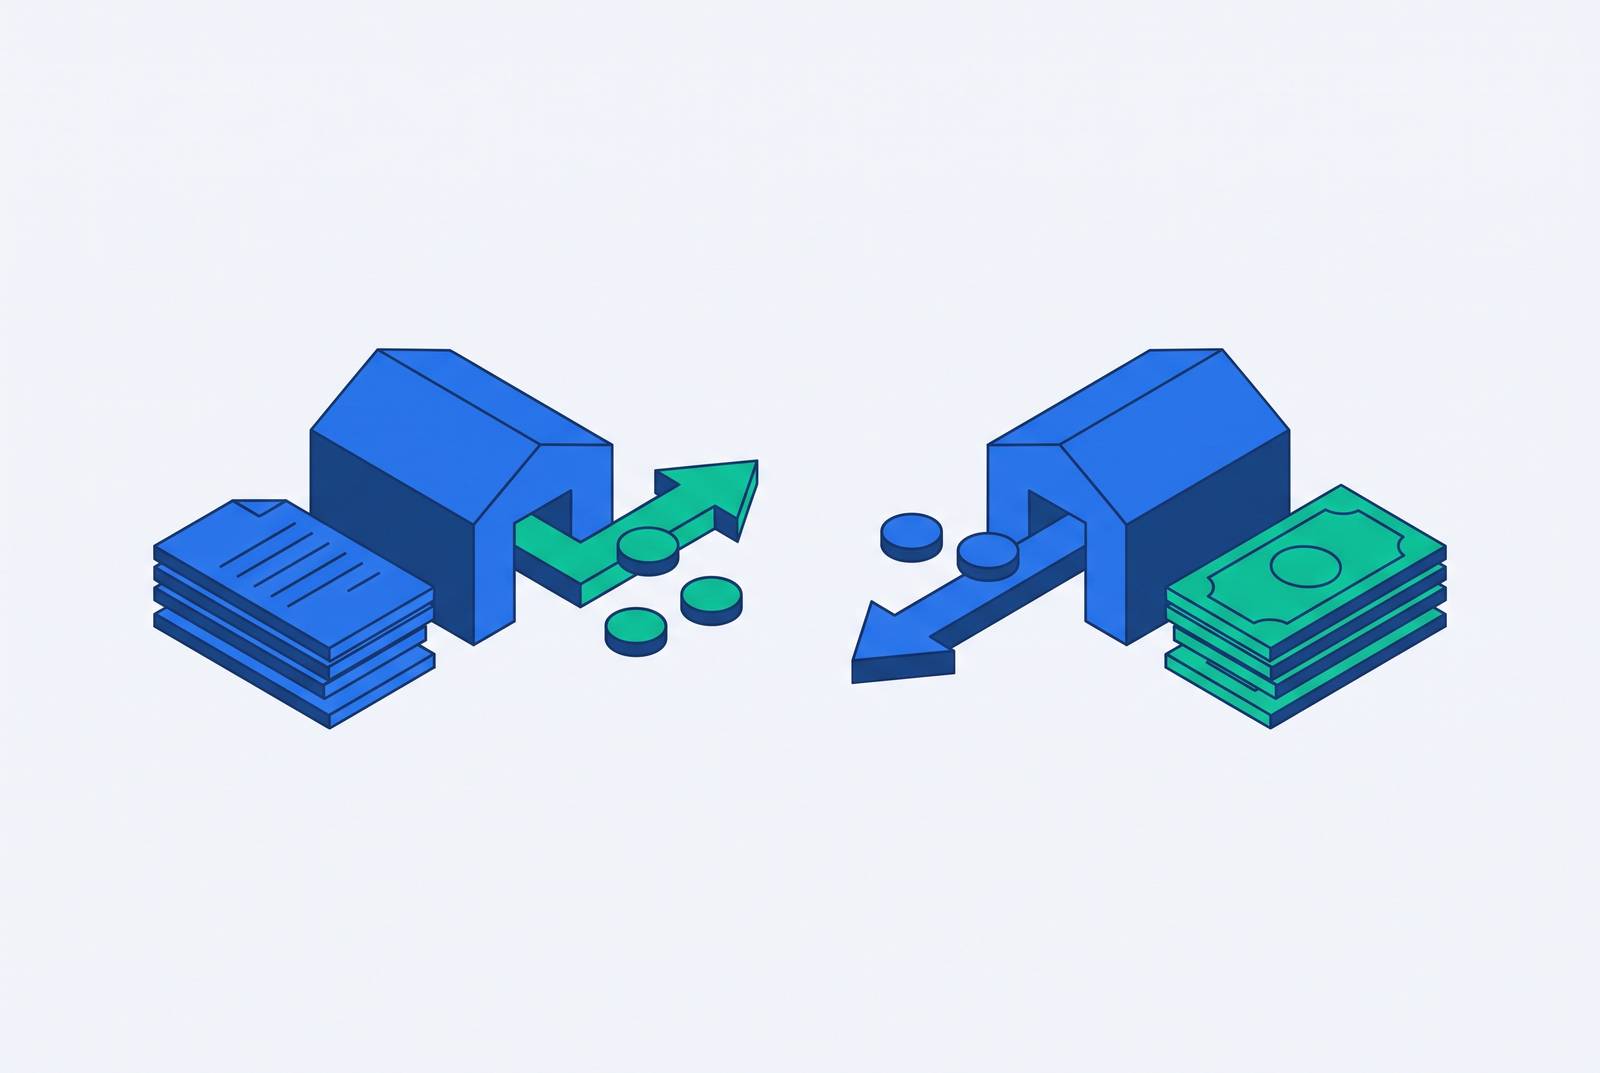
Accounts payable and accounts receivable are two sides of the same coin: one tracks money going out, the other tracks money coming in. Finance teams that watch only one side are driving with a hand over one eye. AP is what a company owes suppliers for goods or services already received on credit, usually due in 30, 60, or 90 days. AR is what customers owe the company for work already delivered but not yet paid for, earned revenue still sitting on a promise.
Both are short-term by design. Most invoices resolve inside a year, which is why they land together on the "current" side of the balance sheet. To be clear about what AP is not: it's not payroll, and it's not a mortgage or other long-term debt, though a payment toward that debt might pass through AP on its way out the door.
Picture it simply. A manufacturer orders raw materials and gets a Net 30 invoice. That amount sits in AP until it's paid off. A consulting firm finishes a project, sends the invoice, and that amount sits in AR until the client pays up. Here's the part that trips people up: one company's AP is another company's AR. Same invoice, same dollar amount, living on opposite sides of two different ledgers at the same time. Less a mirror, more a see-saw. Somebody's always on the other end.
How AP and AR sit on the balance sheet, and why the placement matters
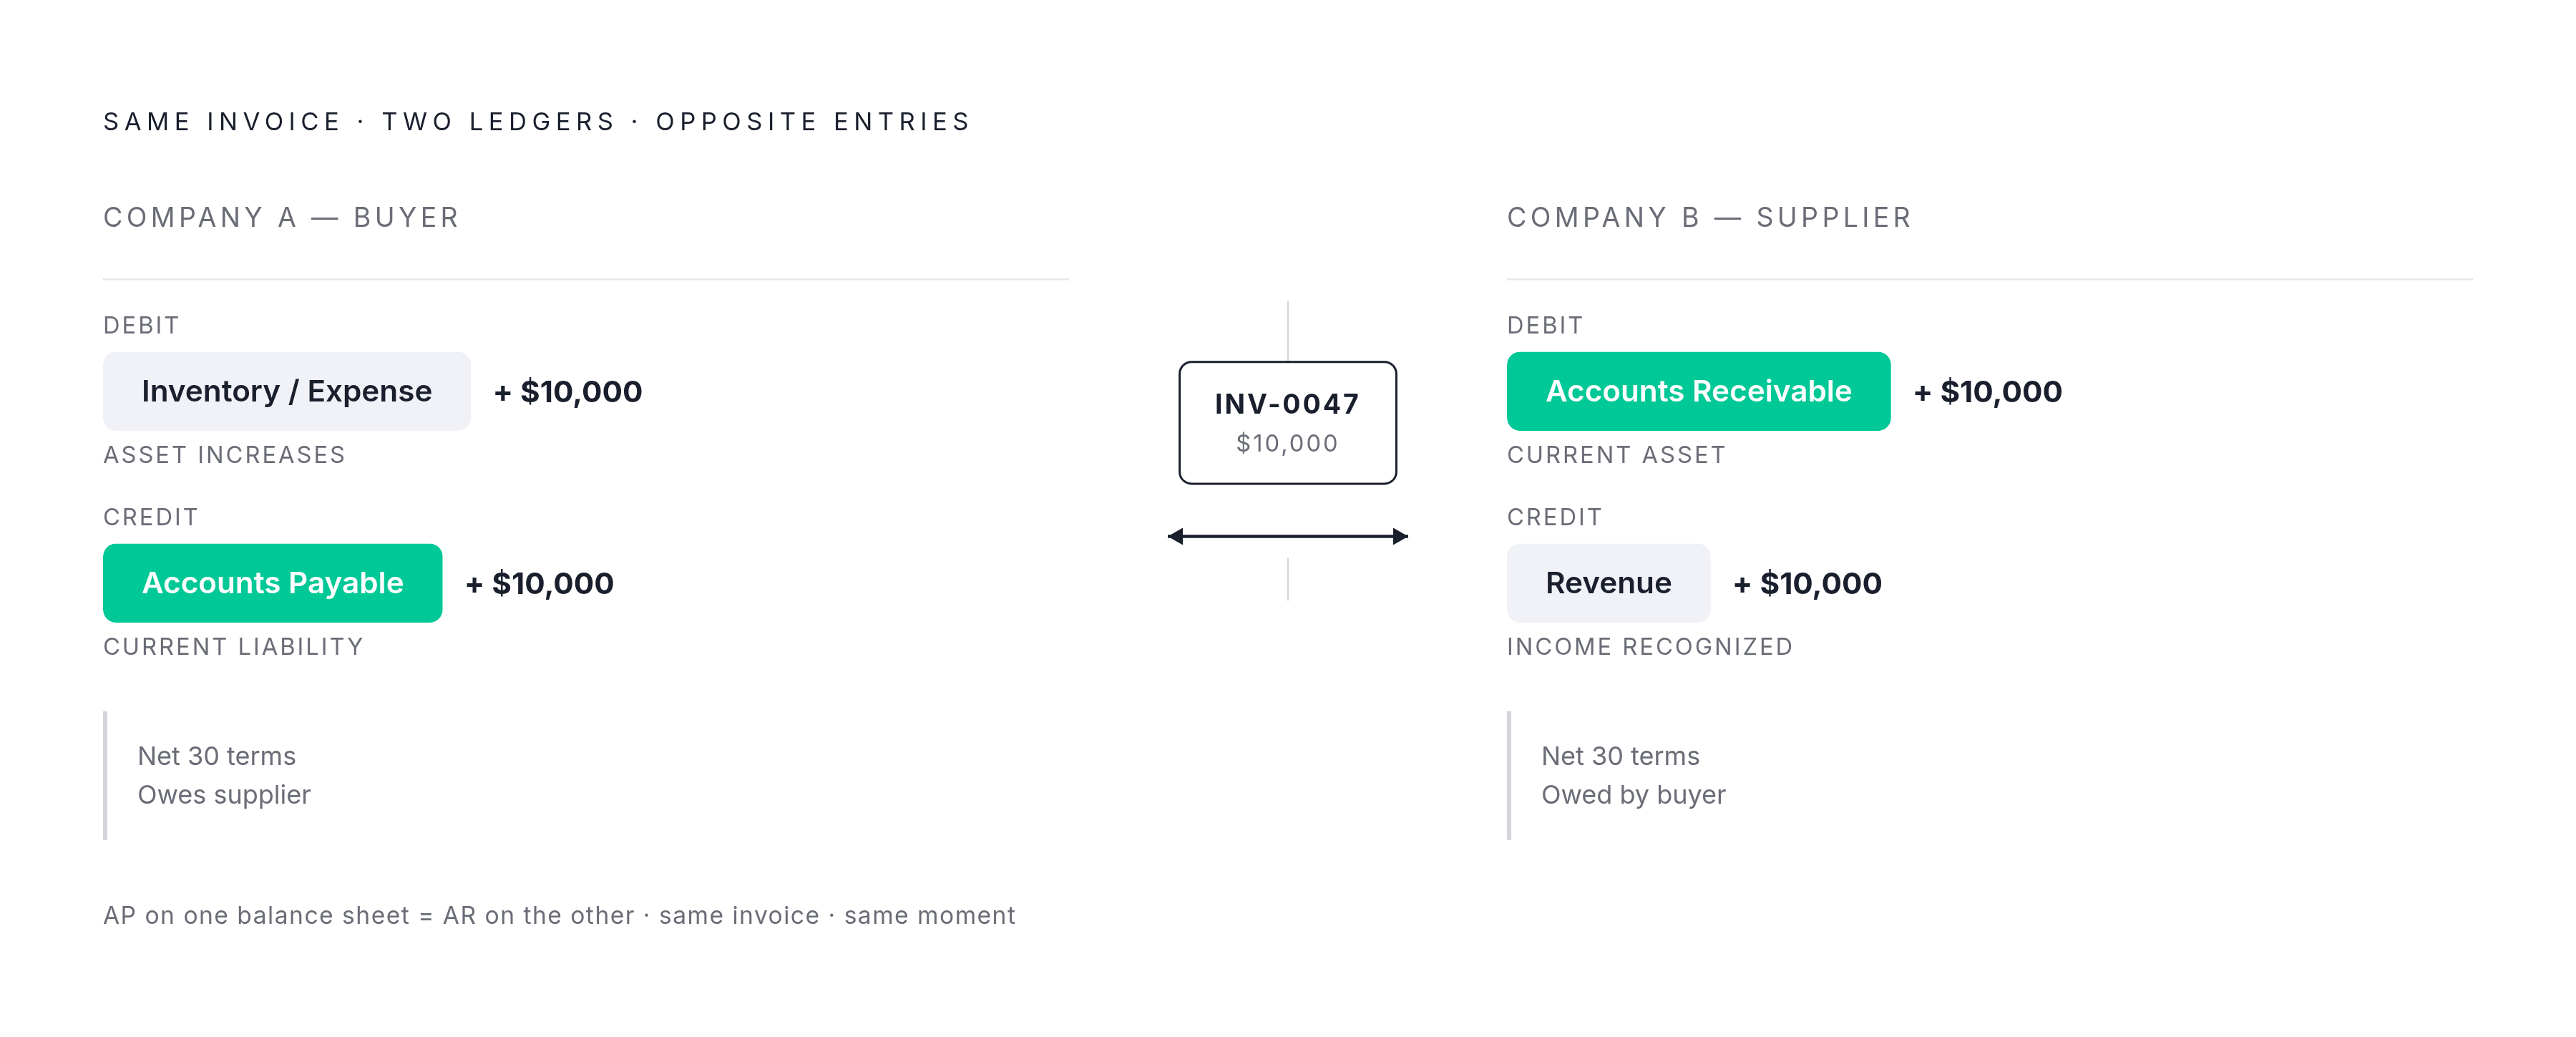
AR counts as a current asset. It's money the business expects to collect within the year, and even though it hasn't landed yet, it's a resource the company already controls in a legal sense. AP is the opposite: a current liability, an obligation owed, chipping away at net worth until it's settled.
Both live in that "current" bucket, apart from long-term assets and long-term debt. That separation matters more than it sounds like it should, because it's the line most lenders and investors look at first when they're judging how liquid a business actually is.
Here's a wrinkle worth knowing: because AR is an asset, unpaid invoices represent real economic value the business already controls. A stack of receivables isn't just paperwork sitting in a drawer, it's a resource with weight on the balance sheet. On the AP side, a rising balance usually means the company is leaning harder on supplier credit to fund day-to-day operations, while a falling balance means it's settling up faster. Neither is automatically good or bad. Both are signals, not just bookkeeping entries.
The balance sheet is a snapshot, one frozen moment. Cash flow is the video that shows how that snapshot came to be.
How the two functions move cash in opposite directions
AP drives cash out. Every supplier payment shrinks the funds on hand, and the timing of those payments is something finance teams actively steer, not something that just happens to them. AR drives cash in. Collecting from customers refills the tank, and any delay in that collection starves the cash available to cover AP.
When inflows and outflows move in sync, a business can plan several steps ahead with real confidence. When they fall out of step, say AR slows while AP bills keep coming due, a cash gap opens fast, and it doesn't close on its own.
One formula ties the whole thing together: the Cash Conversion Cycle, or CCC. It's Days Inventory Outstanding plus Days Sales Outstanding minus Days Payable Outstanding. Trim ten days off DSO for a company pulling in $50 million a year, and $1.37 million in cash frees up. No new customer, no price hike, just faster collection. That's the kind of number that makes a CFO sit up straight.
AP plays its part too. Stretching out DPO, paying suppliers later, shortens the cycle, while paying faster lengthens it. Push suppliers too far past their patience, though, and the relationship frays, maybe the terms get worse next time around. Optimizing AP and AR in isolation quietly undercuts both. The real work is managing them together, like juggling two ends of the same rope.
The journal entries behind each function, what actually gets recorded
AP follows a simple two-step. When an invoice comes in, the company debits an expense account (inventory, supplies, whatever got bought) and credits Accounts Payable. When the payment goes out, it debits Accounts Payable and credits Cash. Net effect: the liability disappears, and so does some cash.
AR runs the same steps in reverse. A credit sale debits Accounts Receivable and credits Revenue. When the customer finally pays, the company debits Cash and credits Accounts Receivable. Net effect: the asset clears, cash goes up.
If that's confusing, here's the shortcut. AP starts with a liability and ends with less cash. AR starts with an asset and ends with more cash. Opposite paths, same destination: the books stay balanced.
Both sides depend on matching to close the loop cleanly. AR teams match incoming payments to the right open invoice. AP teams match invoices against purchase orders and delivery receipts, the so-called three-way match. This is exactly where things go sideways in practice. AP errors show up at that three-way match, when the invoice doesn't line up with what was ordered or received. AR errors show up at cash application, when a payment gets applied to the wrong invoice, or not applied at all.
The KPIs that score each side of the ledger
DPO, Days Payable Outstanding, is AP's report card. It measures the average number of days a company takes to pay its suppliers: average AP balance divided by cost of goods sold, times the number of days in the period. A higher DPO keeps cash in the business longer, but push it too far and suppliers start pushing back. A lower DPO strengthens relationships but tightens cash. Most AP teams that manage DPO as a lever prioritize paying invoices that are already due or overdue. A smaller group pays early specifically to capture early-payment discounts, a more proactive approach to working the AP function.
DSO, Days Sales Outstanding, is AR's report card. It tracks how long it takes to collect cash after a sale closes, and it's the metric that keeps showing up at the top across receivables, collections, and billing scorecards alike. It's the shared scoreboard for the entire order-to-cash process. The number that matters most: every ten days shaved off DSO frees up the same $1.37 million on that $50 million revenue company from a minute ago. Worth remembering, not repeating.
CCC ties DIO, DSO, and DPO into one number. As of 2025, the average CCC across a sample of more than 2,700 US public companies sits at 89 days, according to Quadient's research, a useful benchmark for any finance team sizing up where it stands. Global working capital climbed to 78 days in early 2025, its highest point since 2008, and US companies are collectively sitting on $1.7 trillion in excess working capital. DPO and DSO pull in opposite directions inside that cycle. Stretching DPO and shrinking DSO both help the CCC, but each one runs into a ceiling set by how customers behave and how patient suppliers are willing to be.
Where AR breaks down in practice, the late payment problem
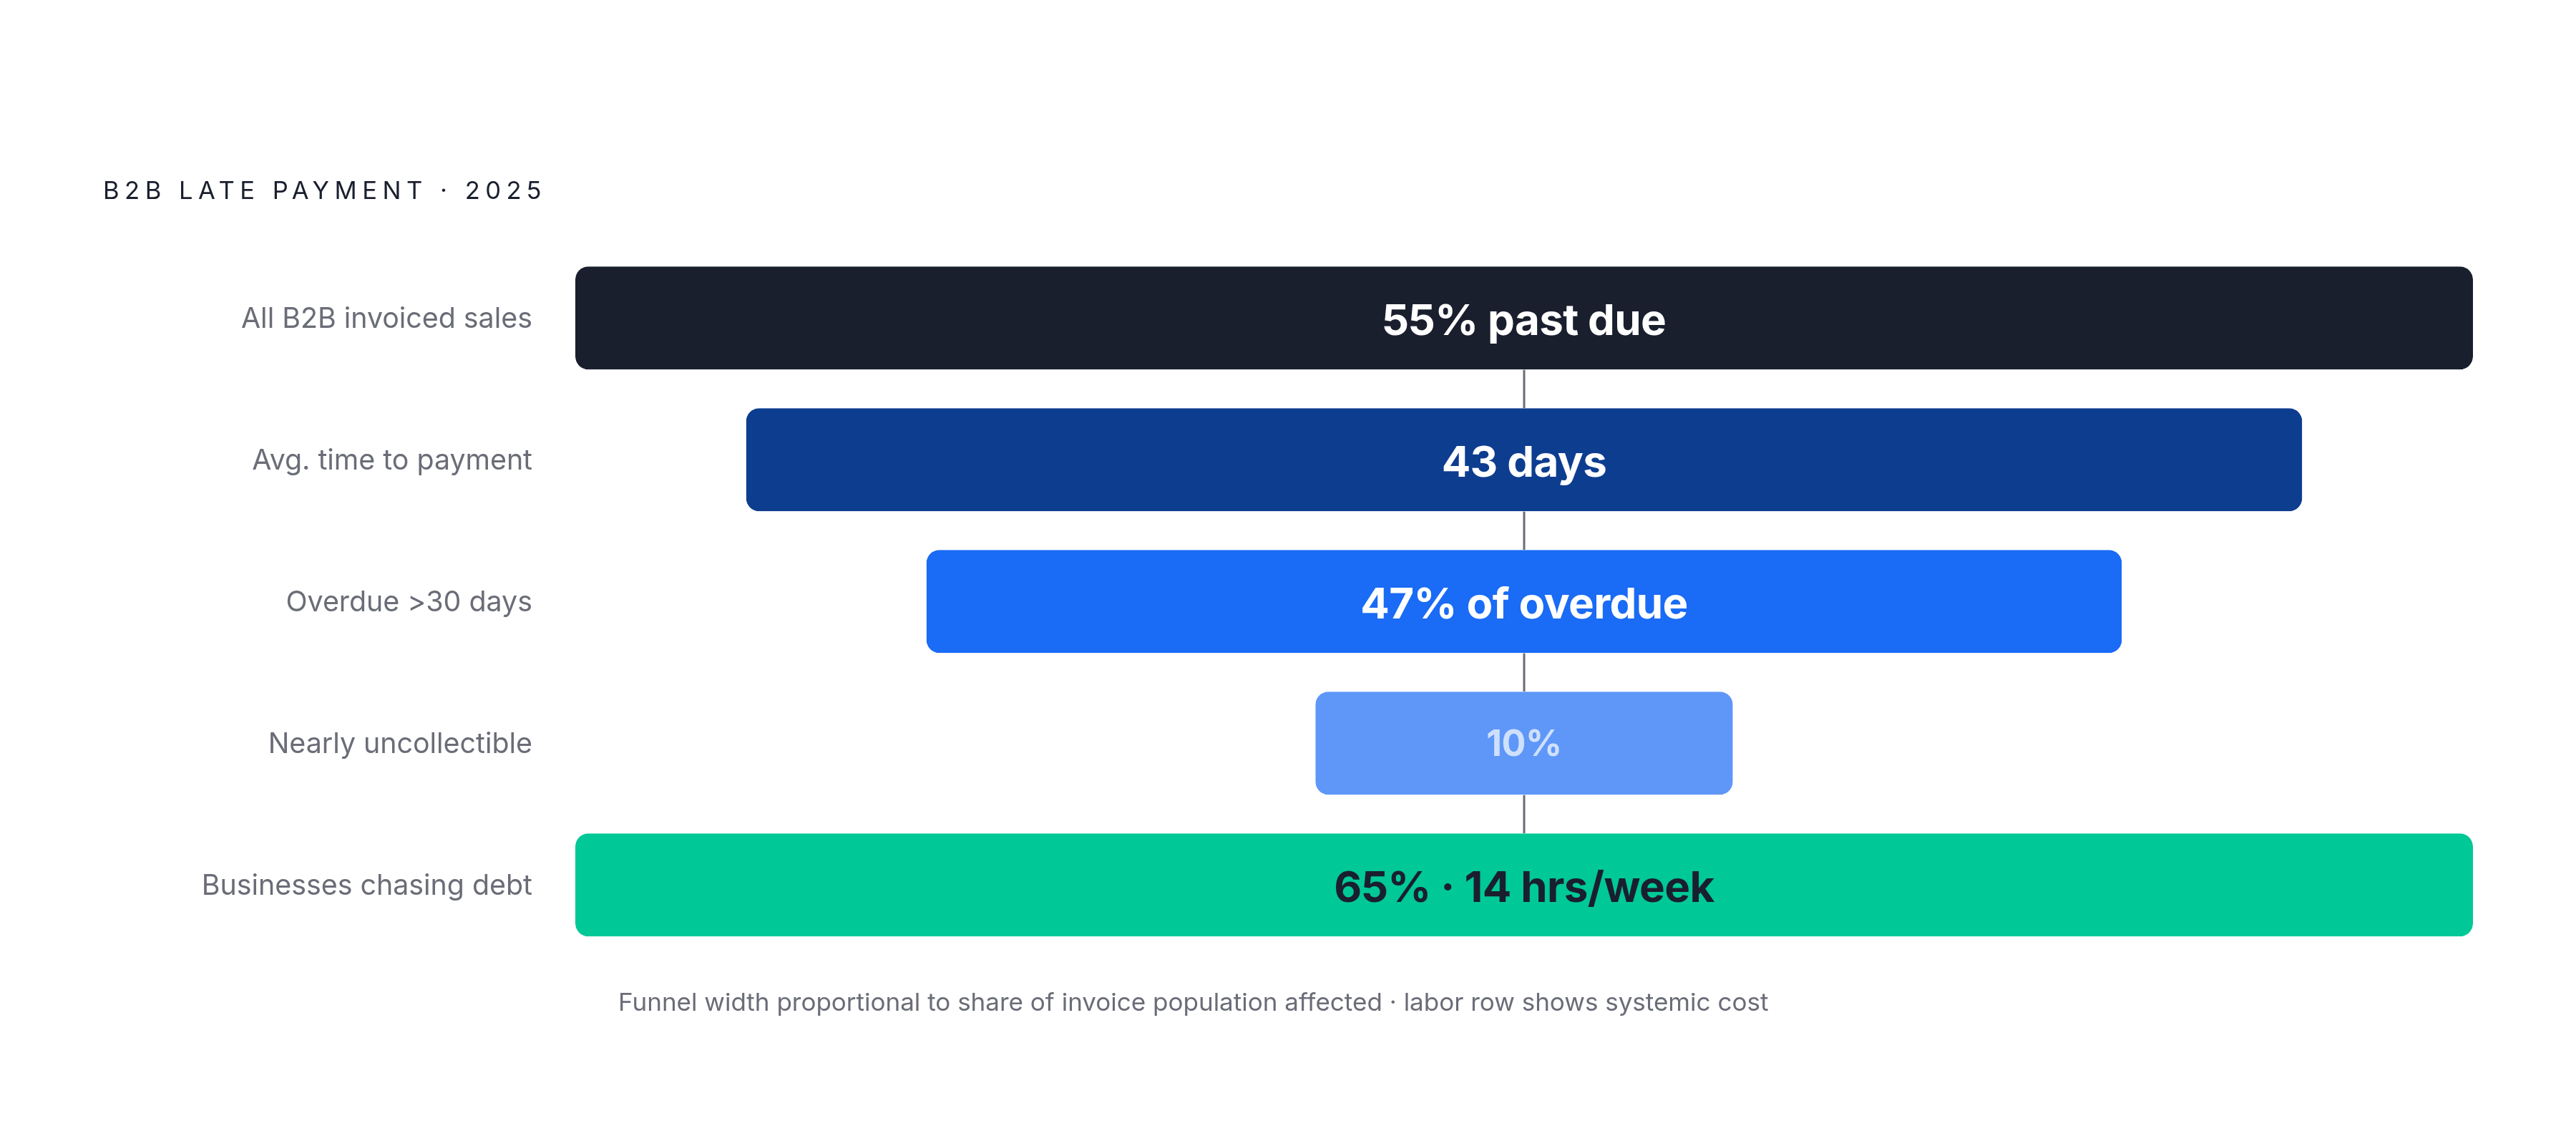
More than half of all B2B invoiced sales in the US, 55%, are sitting past due in 2025. The average business waits 43 days just to get paid. That's not a rounding error. That's a delay baked into how B2B commerce runs.
Small businesses feel it hardest. More than half, 56%, report being owed money on unpaid invoices, with an average of $17,500 outstanding per business at any given time. Of all overdue invoices, 47% stretch past 30 days late, and 10% drift so far out they become close to uncollectible. Atradius's 2025 report on US B2B payment trends puts 43% of the total value of credit-based B2B sales as overdue, with only 52% paid on time and 5% written off entirely as bad debt.
Chasing that money isn't free either. Roughly 65% of businesses spend around 14 hours a week hunting down overdue invoices, hours that could go toward actual finance work instead of playing collections agent. A lot of that delay traces back to something dumbfoundingly simple: communication breakdowns. Versapay's research pegs the monthly cost of those lapses at close to $4 million in outstanding invoices, which reframes late payment as less of a customer character flaw and more of a process failure. That's the part worth sitting with: the invoice usually isn't wrong, it's just stuck somewhere nobody's looking.
The fallout spreads past finance. Small businesses hit harder by late payments were over 1.3 times more likely to report trouble hiring skilled workers. A slow-paying customer today can mean an unfilled job opening down the line. Underneath it all sits an infrastructure gap: 91% of businesses still rely on paper checks, and only 17% have fully automated their AR process. The fix exists. Adoption just hasn't caught up, and that gap is the whole story.
Where AP breaks down in practice, the manual processing trap
On the AP side, the story runs strikingly similar, just with the direction flipped. Roughly 68% of AP teams still manually key invoices into their ERP or accounting software, and fewer than 32% run anything close to an automated process. Manual entry is a slow, error-prone process. It's a bottleneck wearing a disguise.
That default carries a real cost. Processing an invoice by hand runs about $15 on average and takes 14.6 days, numbers that don't sound dramatic until they're multiplied across thousands of invoices a year. Add an error rate hovering around 39%, each one needing to get untangled before payment can even happen, and the delays compound fast.
Volume makes it worse. Globally, 49% of teams spend more than five days a month just processing invoices. In the US, that jumps to 63%, compared with 26% in the UK, a gap that says a lot about how unevenly automation has spread across regions.
None of this stays contained to AP either. About 36% of small and mid-sized businesses say slow incoming payments, their AR problem, directly hurt their ability to pay their own suppliers on time, their AP problem, and 18% say it's affected their ability to pay employees. The two functions aren't just conceptually linked, they're operationally tangled, like two gears that only turn together. And manual, low-control AP environments carry risk beyond slowness: 79% of organizations reported being targeted by payment fraud attempts in 2024.
Best practices for managing AP effectively
Pay invoices promptly. Sounds obvious, but delays invite late fees, strain supplier relationships, and quietly forfeit early-payment discounts that were sitting right there for the taking. Most AP teams that prioritize due-or-late invoices are playing defense. The smaller group capturing early-pay discounts is playing offense, and it shows up on the balance sheet.
Run a three-way match on every invoice: check it against the purchase order and the actual goods or services received before anything gets approved. That single habit is what catches the errors behind the roughly 39% of invoices that contain mistakes and stops duplicate or flat-out wrong payments before they leave the building.
Build in real controls. Dual approvals, audit trails, restricted access to who can even initiate a payment. Given that most organizations faced fraud attempts in 2024, this isn't optional hygiene, it's the lock on the front door.
Use the full payment window a supplier gives without tipping into late fees, and time those payments against actual cash on hand. That's DPO management done on purpose, not by accident. Reliable, on-time payment cycles also build trust with vendors, and trust is currency when it's time to negotiate better terms. Reconcile AP records against vendor statements regularly, not just at quarter-end, to catch discrepancies before they turn into surprises. And where volume justifies it, automate. The AP automation market was valued at roughly $3.07 billion in 2023 and is projected to hit $7.1 billion by 2030, a trajectory that says plenty about how many finance teams have already made the call.
Best practices for managing AR effectively
Send invoices immediately, and make them impossible to misread. Vague invoices breed disputes, and disputes are just delayed payments wearing a different hat. Clear itemization, explicit due dates, no guesswork.
Run credit checks before extending payment terms to a new customer. It's a filter, not a formality, and it's one of the more effective ways to keep that 10% of invoices from sliding into the "probably never collecting this" pile.
Automate the routine reminders, then build a real escalation path for anything crossing 30 days overdue, since nearly half of overdue invoices land in that zone. Automation handles the nudge. A human handles the conversation once nudging stops working.
A lot of stalled invoices aren't stuck because the customer refuses to pay. They're stuck on something boring, such as a missing tax form, a clunky supplier portal, or an email that sat unanswered for two weeks. Chasing down those unglamorous blockers often unlocks payment faster than another reminder ever could. Offer multiple ways to pay, ACH, card, online portal, since friction at the payment step is friction the company doesn't need to create for itself. Early payment discounts work here too, the AR mirror image of AP's early-pay strategy, pulling cash in faster without a single collections call.
Reconcile the AR ledger often, matching payments to the right invoice quickly, because those communication lapses mentioned earlier add up to nearly $4 million a month sitting in limbo. Predictive tools are increasingly closing that gap on their own: models forecasting payment dates in the high 80s to low 90s percent accuracy range, flagging at-risk accounts weeks before a missed payment, and cash application tools matching payments to invoices in the mid-90s to high-90s percent range, cutting manual reconciliation time down considerably.
Reading AP and AR together to assess working capital health
Neither number means much alone. A low DSO paired with an extremely low DPO might look great until it's clear the company is collecting fast but paying out even faster, quietly draining cash while looking efficient on paper. A high DPO paired with rising DSO is the opposite warning sign: a cash gap building in slow motion.
When AP and AR move in sync, a business can plan for growth with a straight face. When they diverge, AR dragging while AP accelerates, that's not a footnote. That needs attention immediately. Versapay's research finds CFOs overwhelmingly agree that AR teams would get more done working closely with their AP counterparts, which says something uncomfortable: the silo between these two departments is itself a working capital risk, not just an org chart quirk.
The macro numbers back the urgency up. US companies are holding $1.7 trillion in excess working capital. Global working capital hit 78 days in 2025, its highest point since 2008. Nearly a third of businesses, 31%, say late payment problems got worse over the past year, and 51% point to uneven cash flow as an ongoing challenge. These aren't edge cases tucked into a footnote. They're the operating environment most finance teams work in right now.
Forecasting gets sharper once both sides are visible at once. AR tells a finance leader roughly when cash is likely to show up. AP tells them exactly when it has to go back out the door. Together, they draw the actual liquidity window a company has to work with, not the fantasy one drawn from a single metric in isolation. Companies that tighten DSO, stretch DPO within reason, and shrink the overall CCC free up cash that can fund growth without borrowing a dime or issuing new equity. That's the point where accounting stops being bookkeeping and starts being strategy.
Even when the mechanics get complicated, the takeaway stays simple: treat AP and AR as one connected system, not two departments running separate scoreboards. That's what turns a stack of ledger entries into an actual, usable picture of financial health.