Finance Operations KPIs Beyond the Income Statement
Five operational metrics reveal what your income statement hides about cash flow and finance health.
Profit and cash are not the same thing, and the income statement will never tell you which one you've got. It shows revenue, gross margin, net income: the score after the game's already over. What it won't show is how fast cash actually moved, how long the books took to close, or whether anyone's forecast was worth the paper it got printed on. Five domains fill that gap: working capital velocity, AR and collections, close efficiency, forecast accuracy, and finance function cost. None of them replace knowing how to read a P&L. They just answer the questions the P&L leaves sitting on the table.
How working capital velocity shows whether profit is becoming cash
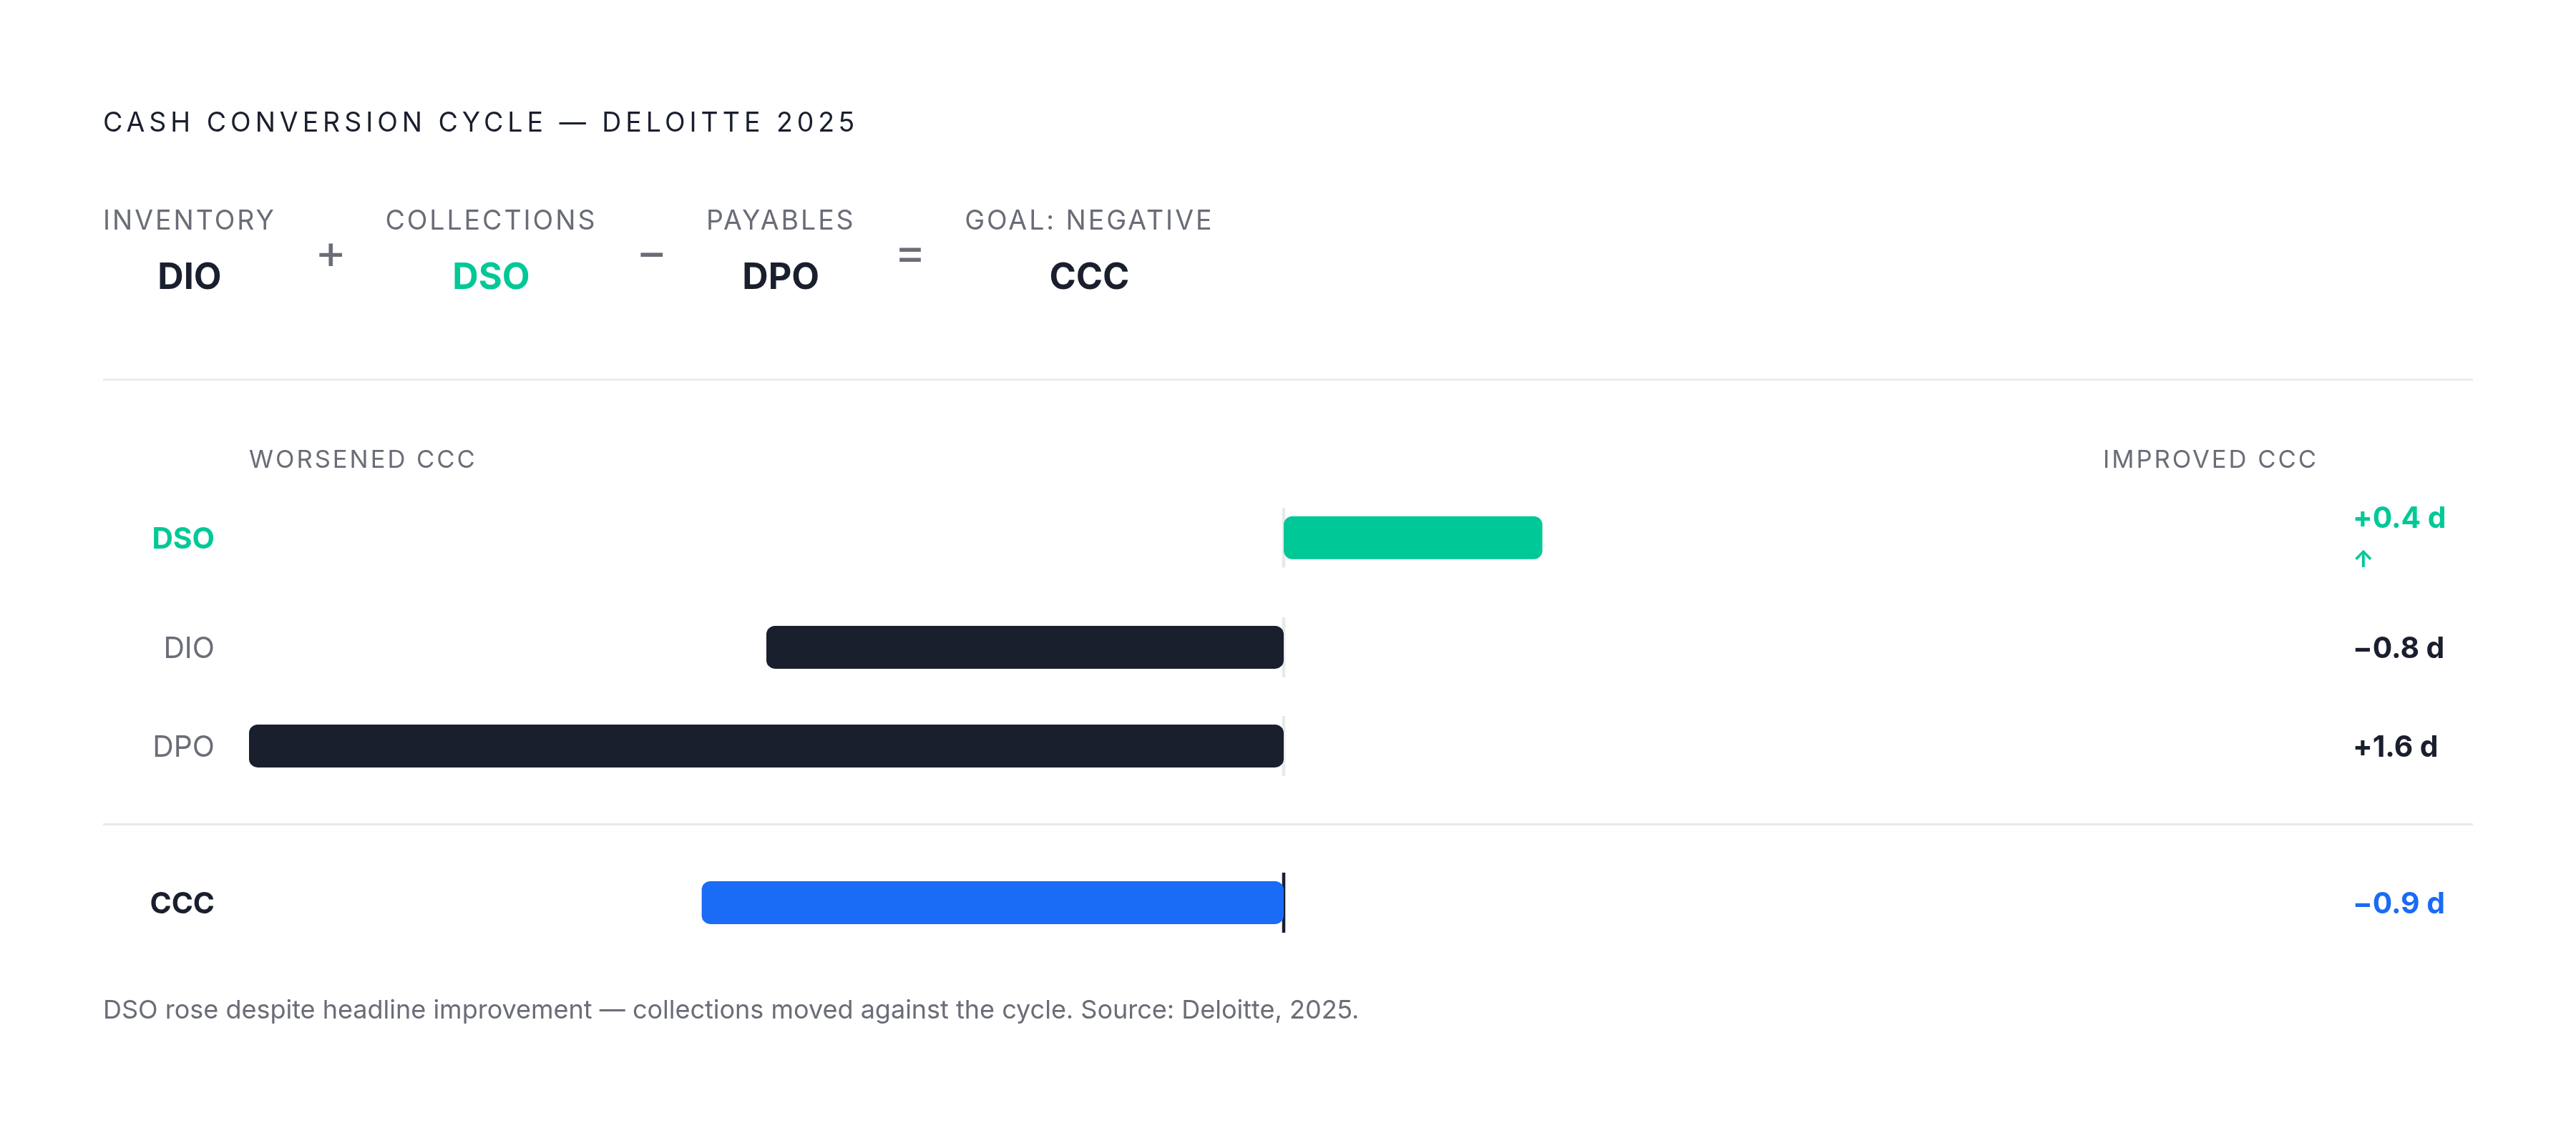
A company can post a healthy profit and still run out of cash. That's not a contradiction, it's just what happens when nobody's watching the Cash Conversion Cycle. CCC is DIO plus DSO minus DPO: days of inventory, plus days to collect from customers, minus days before you have to pay your own suppliers. It measures the gap between spending cash and getting it back.
The best possible number here is negative, and A negative CCC is the goal: collecting from customers before paying suppliers, so suppliers effectively finance inventory without ever agreeing to. That's not a clever accounting trick. It's a structural advantage baked into the business model itself.
Deloitte's 2025 Working Capital Roundup, covering more than 2,300 companies, found CCC shortened by roughly 0.9 days year-over-year. Sounds like good news, until you look at where the improvement came from. Inventory days fell, and suppliers got paid later, but DSO rose. Collections got worse even as the headline number improved, which is exactly the trap with CCC: it can look fine on the surface while the AR side quietly rots underneath.
Most working capital programs go straight for DPO, because stretching payment terms is the easy lever to pull. It's also the wrong one to lean on. It works right up until suppliers start pushing back or repricing to cover the float, and then the savings disappear into higher unit costs nobody bothered to trace back to the original decision. Durable CCC improvement has to come from fixing DSO instead. Delaying payments just borrows time from a relationship, and eventually the bill comes due, usually with interest attached in some quieter form.
Days Sales Outstanding and the AR aging signal inside the CCC
DSO gets cited more than any other collections metric, and it's also the easiest one to misread. It measures average days to collect after invoicing, and a flat DSO can hide invoices quietly sliding into the 60 and 90 day buckets while the average holds perfectly steady.
That's why AR aging (current, 1 to 30, 31 to 60, 61 to 90, and 90-plus days) tells you more than the single DSO number ever will. Aging shows which customer relationships are actually degrading, and whether the friction is structural or just somebody being slow to pay.
Here's what actually inflates DSO, and none of it shows up on the income statement. A missing W-9 sits in someone's inbox for two weeks. A supplier portal rejects an invoice over a formatting mismatch that has nothing to do with whether the customer can pay. A dispute over one line item stalls the whole invoice instead of just the disputed part. These are potholes in a process, not financial problems, and the P&L is blind to every one of them.
Supplementary collection metrics fill the gap DSO leaves open, offering a more honest read on how the AR team is actually performing against what was realistically collectible in a given period. Deloitte's finding that DSO rose even as overall CCC improved confirms the AR problem is real, and it won't fix itself through smarter inventory or payables management. No amount of squeezing suppliers fixes a broken invoicing process.
Ask the diagnostic question directly: is DSO high because customers are behaving badly, or because the AR process itself has friction nobody's bothered to fix? Most of the time, it's the second one. And most of the time, nobody's checked.
What the financial close cycle reveals about finance function health
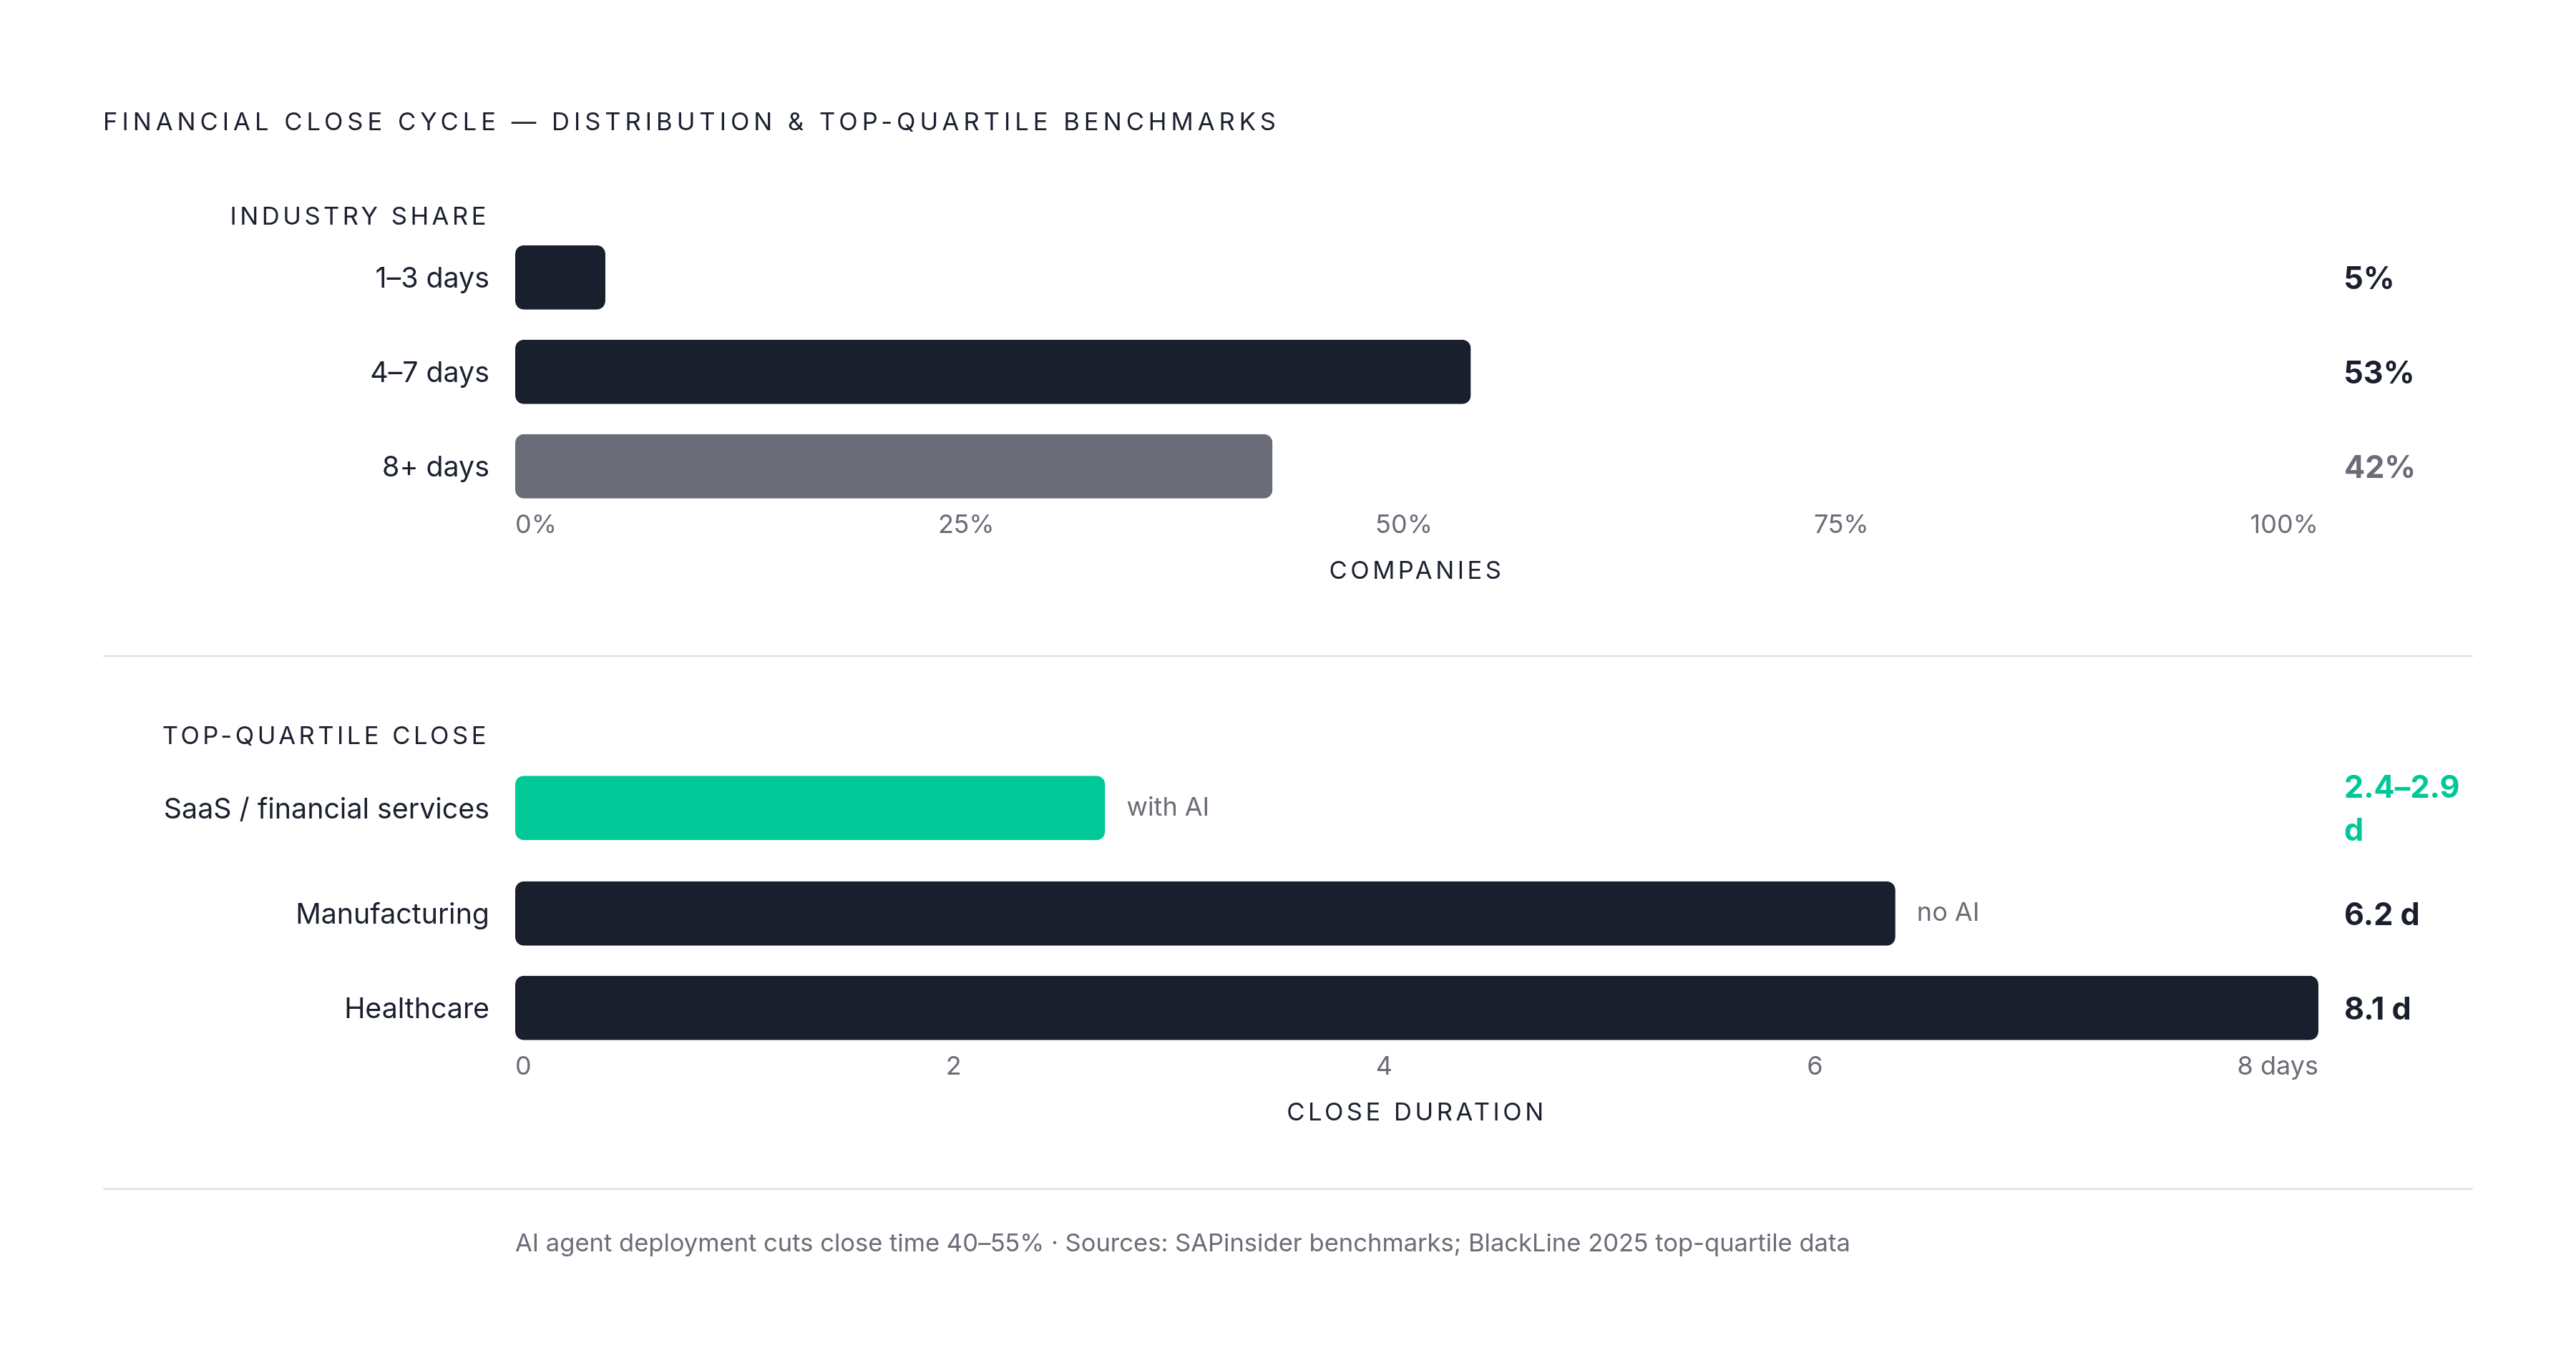
Close cycle time counts the calendar days between period-end and final, auditable financials. It's less a bookkeeping metric than a readout of how mature the whole finance function actually is.
SAPinsider's benchmark found 53% take four to seven days to close, 42% take eight days or more, and only 5% close in one to three days. Meanwhile 85% of those same respondents name financial performance optimization and risk and compliance as top strategic priorities. That's a contradiction sitting in plain sight: a slow close undercuts both priorities at once, every single reporting period.
BlackLine's Finance Benchmark 2025 breaks the spread out further. Top-quartile SaaS and financial services teams using AI close in 2.4 to 2.9 days. Manufacturing averages 6.2 days without AI. Healthcare averages 8.1 days, dragged down by revenue cycle reconciliation, payer mix adjustments, and deferred revenue recognition. The gap tracks closely with automation adoption, and the benchmarks show it widening as AI deployment accelerates.
A few sub-metrics explain why a close drags on. Late journal entry rate measures how much changes after the close should've already stabilized, a sign of weak upstream systems or unclear cutoff rules. Manual versus automated JE ratio flags process gaps, not just missing software, since a high manual share usually means nobody's redesigned the workflow around the tools they already bought. Post-close adjustment rate tracks how often the "closed" books get changed anyway, one of the clearest accuracy signals available.
The cost of a slow close isn't just calendar days. It's delayed decisions and a shrunk window for actual analysis. SAPinsider found only 17% of finance organizations call themselves fully integrated across SAP and third-party platforms, which leaves manual reconciliation as the default for most everyone else. BlackLine's Finance Benchmark 2025 found AI agent deployment compresses the close by 40 to 55% across six industries, the largest single-source improvement benchmarked since 2020. If a finance leader is picking one place to spend a tech budget this year, that's the number to start from.
AP process metrics and what invoice cycle time shows about operational drag
DPO is the working capital number. Invoice cycle time and cost per invoice are the process numbers underneath it, and they explain how that DPO number gets produced, and at what cost to the people actually doing the work.
In a manual environment, invoice cycle time runs around 14.6 days. Automation brings that down to 3 to 5 days or less. Processing time per invoice tells a similar story: 10 to 15 minutes by hand, under two minutes with automation. Faster cycle time means catching early-payment discounts and dodging late fees, a direct hit to the P&L that never shows up labeled as such.
Touchless processing rate, the share of invoices handled with zero human involvement, separates the high performers from everyone else. Top AP teams hit 60% to 80% touchless. Ardent Partners puts the broader market at over 60% of invoices still requiring some human touch, which tells you automation adoption is uneven at best. Most companies are further behind than they think, and the gap between the leaders and the pack is widening, not closing.
Invoice error rate is another tell. The Institute of Finance & Management (IOFM) finds automation brings this below 0.8%. Errors mean rework, delayed payment, and strained supplier relationships, none of which show up cleanly anywhere on a financial statement.
Cost per invoice might be the cleanest ROI number in the entire AP function. Effective automation can cut overall AP operational costs by as much as 30%, a meaningful reduction in the fully loaded cost of running the AP function. AP metrics reveal whether DPO got stretched through genuine operational efficiency, or through squeezing suppliers harder than they can take. The P&L can't tell those two apart. The KPIs can, and that difference matters the next time a supplier renegotiates terms out of nowhere.
Forecast accuracy metrics and what they reveal about FP&A model quality
Forecast accuracy works almost like a meta-metric. It measures how reliable the models are that feed every other projection in the building, and when the underlying model is off, that error compounds across revenue, cost, and cash planning all at once.
CFO Advisors tracks five numbers here, and each one catches a different kind of failure. MAPE (Mean Absolute Percentage Error) is the headline number, with top-quartile performers under 5%. Forecast cycle time measures how long a new forecast takes to build, and top quartile is under one week. Variance attribution rate shows the share of forecast misses traced back to a specific driver, above 90% for top quartile; below that, teams are guessing at root cause instead of fixing it. Stakeholder adoption rate tracks whether business unit leaders actually use the forecast, above 85% for top quartile. Corrective-action lag measures how fast teams adjust once a forecast misses, under five days for top quartile.
Budget variance analysis adds one more guardrail: material deviations should get flagged as unusual expense volatility worth digging into, not waved through because the quarter's already busy enough.
A Boston Consulting Group survey found 90% of organizations using AI to build KPIs called those KPIs more effective and more insightful. That number matters less than what it implies: the teams getting this right aren't smarter, they're just automating the parts of forecasting that used to eat a week of somebody's time.
Here's what poor forecast accuracy hides: the income statement reports actuals with total precision, down to the decimal. If the forecast built around those actuals was wrong, the P&L will never explain why. Forecast accuracy metrics are the only place that explanation lives.
Finance function cost ratios and when headcount metrics matter
APQC benchmarking data tracks the core cost metrics here: total finance function cost as a percentage of revenue, finance FTEs per billion dollars of revenue, and personnel cost per finance FTE.
Cost per transaction shows whether the finance function actually scales or just gets bigger. A company that doubles transaction volume without doubling cost is capturing real operating leverage. One that doubles both isn't gaining anything, it's just hiring its way through the same problem, and calling the new headcount "growth" instead of what it actually is.
Automation implementation rate matters here too, and it reflects strategic capability, not pure cost-cutting. Leaders who pull off automation successfully are proving they can manage change, not just trim a budget line.
Talent signals round out the picture. Overtime hours worked by the F&A team act as a leading indicator of process overload, showing up well before attrition data ever does. Attrition itself in F&A is often a symptom of manual, low-value work piling up, a cost the income statement only registers indirectly, as recruitment and training line items months after the damage is already done.
Compliance metrics belong in this bucket too: audit findings and the rate of post-audit adjustments. Clean audit reports and on-time filings aren't just compliance checkboxes, they're operational KPIs that show whether the close and reporting process is actually under control, or just getting there in time on a wing and a prayer.
Put together, the argument here is simple: a finance function can look lean and efficient on the P&L while quietly burning out its own team and stacking up audit risk nobody's tracking.
How FASB's KPI standardization effort changes the stakes for finance leaders
FASB issued Invitation to Comment No. 2024-ITC100, "Financial Key Performance Indicators for Business Entities," on November 14, 2024. It's a formal research step toward a possible future standard governing non-GAAP and derived financial measures, and it covers a lot more ground than the title lets on.
FASB defines a Financial KPI, for this purpose, as any financial measure calculated or derived from the financial statements or the underlying accounting records that doesn't appear in the GAAP statements themselves. That definition sweeps in EBITDA, free cash flow, DSO, CCC, and most of the metrics covered in this piece.
CFA Institute's May 2025 response to the ITC lays out the problem in plain terms. In 1996, 59% of S&P 500 companies disclosed at least one non-GAAP measure, averaging 2.5 per company. By 2020, that had climbed to 94% of companies, averaging 7.5 measures each. That growth is the whole argument for standardization in one pair of numbers. CFA Institute flags questionable adjustments that exclude costs that are actually recurring, poor comparability across companies and time periods, and murky disclosure of what's being adjusted and why. Non-GAAP measures now often get more prominent placement than the GAAP numbers they're supposed to supplement, and many companies tie executive compensation to these same non-GAAP measures. That turns definitional inconsistency into a governance problem, not just a footnote in the 10-K.
Investors have pushed for standardization here consistently. Preparers, less so, and that tension is exactly what the ITC process is designed to surface. For finance leaders, the message is straightforward: the operational KPIs tracked internally and disclosed externally are both facing more scrutiny over definition, calculation method, and consistency. Getting ahead of that now is a governance advantage, not busywork done to check a compliance box. One thing the FASB process hasn't settled yet is whether any future standard reaches internal management metrics, or stops at what gets disclosed externally. Worth watching as the project moves forward.
Building a KPI stack that connects operational reality to strategic decision-making
Most finance teams track KPIs in silos. AR owns DSO. FP&A owns MAPE. Accounting owns close days. Nobody builds the connected view that shows how friction in one domain shows up as noise in another, and that gap is exactly what turns isolated metrics into blind spots.
The connections aren't mysterious, they're mechanical. A high DSO stretches out CCC, which squeezes operating cash, which forces short-term financing decisions that eventually land on the income statement as interest expense, dressed up as just another cost of doing business. Accounts receivable automation software that chases overdue invoices across email, phone, and SMS with human collections experts behind it exists specifically to attack DSO at the process level before it compounds into a cash problem. A slow close eats into forecast cycle time, which pushes MAPE higher, which drags down stakeholder adoption of the forecast, which weakens budget variance as a control signal from the start.
None of these metrics work as well standing alone as they do stacked together. DSO without aging data hides which customers are actually drifting. CCC without a DPO-versus-DSO breakdown hides whether supplier relationships are quietly absorbing all the strain. Forecast accuracy without adoption data hides whether anyone's even using the number to make a real decision.
The income statement will always tell you what happened. These KPIs are the only ones that tell you why, and more importantly, where the next lever actually sits.