Free Cash Flow vs Operating Cash Flow for B2B Finance Leaders
Understanding which cash metric matters most for payroll, vendor payment, and growth decisions.
A finance team can post a great quarter on paper and still scramble to make payroll the same month. That's the normal gap between what a company earns and what it actually holds in the bank. This piece walks through two metrics built to close that gap, operating cash flow and free cash flow, and shows B2B finance leaders when each one is the right tool for the decision in front of them.
Why profit metrics mislead B2B finance leaders
Accrual accounting lets a business book revenue the moment a sale closes, long before any cash arrives, and it can push some expenses off until later. The income statement can look terrific while the checking account tells a much plainer story. Working capital shifts, slow-paying customers, and inventory sitting on shelves all eat cash, but none of it appears as a loss on the P&L. That's the real gap finance leaders live with: the space between what a business earns on paper and what it actually controls day to day.
B2B makes this worse because the payment terms printed on an invoice are more of a suggestion than a schedule. Thirty days on paper can easily turn into sixty or ninety in practice, and late payment stays a structural drag on collections, so it squeezes available cash even when revenue looks strong. Tools like Invoice Butler, which automate follow-ups across email, phone, and SMS while managing supplier portals, help close that gap by turning invoices into cash faster, cutting into the working capital drag that the income statement never shows.
Net income and EBITDA both answer the same question: what did the business earn? Neither one answers the question that actually keeps a finance leader up at night: what can the business spend? For anyone managing vendor payments, payroll, and growth investment, that second question decides whether Friday's payroll run clears without a phone call to the bank.
Operating cash flow: what it measures
Operating cash flow picks up where profit metrics fall short. OCF measures the cash a business actually generates from its core, everyday activities: selling product, collecting payment, paying suppliers and staff. It asks one direct question: does the operational engine produce real cash, separate from however the business happens to be financed?
The calculation starts with net income, then adds back non-cash charges like depreciation and amortization (accounting entries that lowered reported profit without taking a dollar out of the bank). From there it adjusts for changes in working capital: the swings in receivables, payables, and inventory that tie up or free up cash independent of anything the income statement records. Written as a formula, using the indirect method: OCF = Net Income + Non-Cash Expenses + Changes in Working Capital.
The working capital adjustment is where day-to-day B2B reality appears in the numbers. A business can book a large sale and still show a negative receivables adjustment in OCF if the customer hasn't paid yet, so a big win on the income statement can coincide with OCF going down when collections lag behind sales. Collections efficiency, whether through direct follow-up or AI-powered accounts receivable automation, strengthens this exact line item. A business with steadily positive OCF is funding itself from its own operations, no loans or asset sales required. When OCF falls while net income holds steady, you can tell working capital is quietly soaking up cash the income statement never flags.
Free cash flow
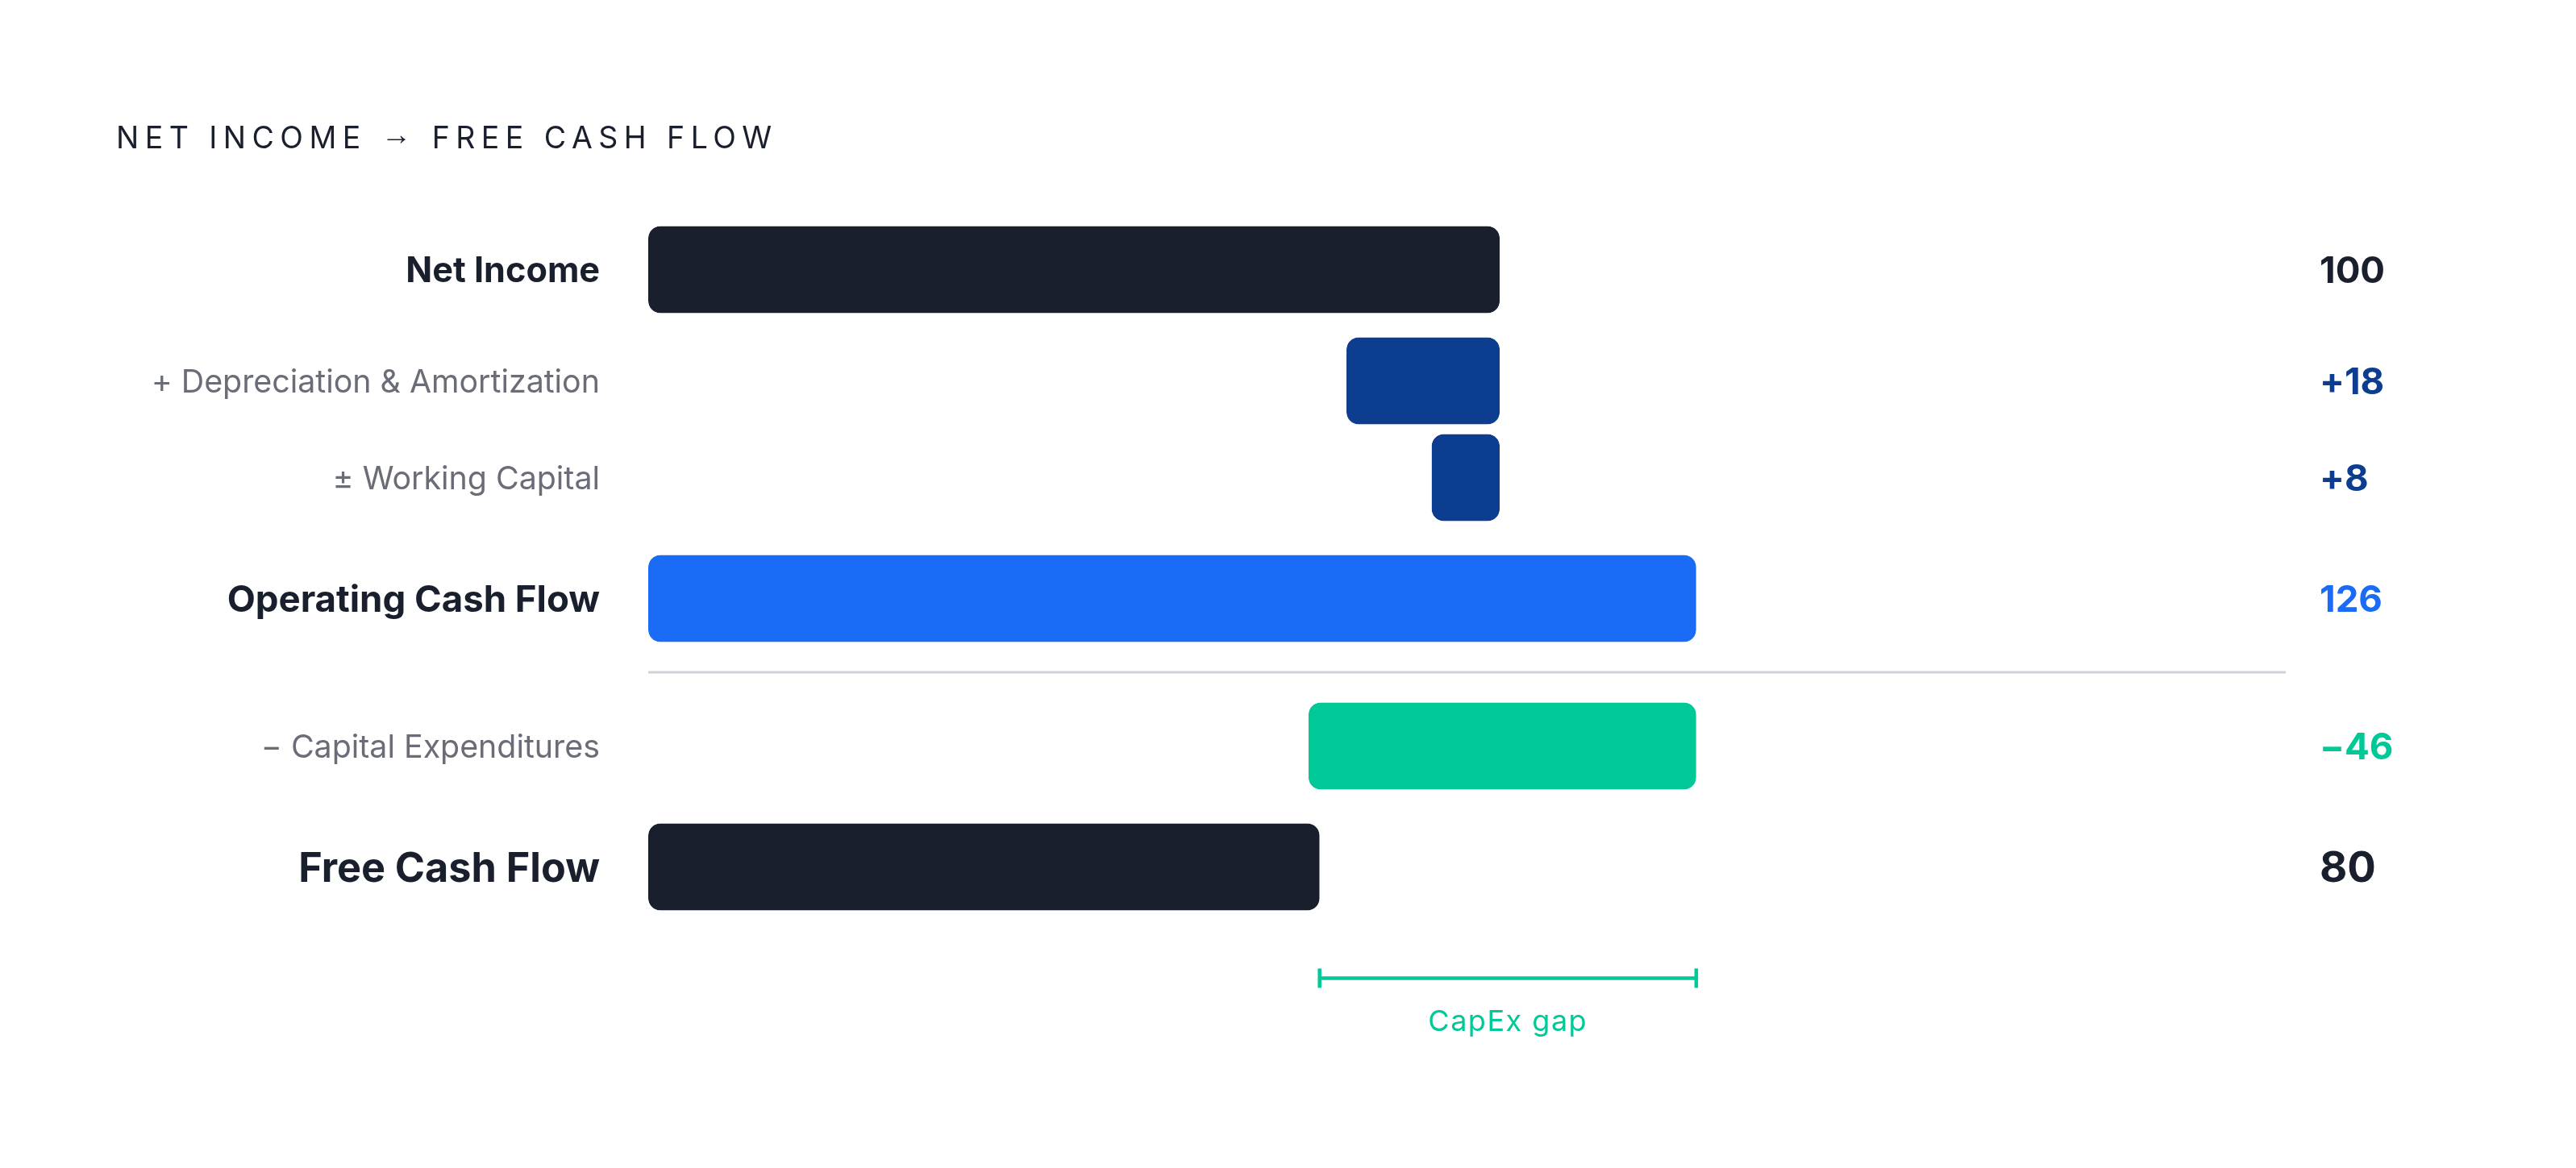
Free cash flow starts where OCF ends. It takes operating cash flow and subtracts capital expenditures, the spending on property, equipment, and infrastructure a business needs to keep running or to grow. What's left shows how much cash remains once the business has paid to keep its asset base standing.
The simple version of the formula is FCF = OCF − Capital Expenditures. Written out in full, you get FCF = Net Income + Non-Cash Expenses − Change in Working Capital − Capital Expenditures. CapEx appears in the investing section of the cash flow statement, usually labeled as purchases of property and equipment, and for most businesses it's not optional. Machines wear out. Software needs new servers. Fleets need new trucks. The cash has to go out the door to keep operations where they are, let alone grow them.
What survives that subtraction is "free" in a specific sense: cash available for choices rather than obligations. Paying down debt, funding an acquisition, issuing a dividend, building a reserve, all of it comes out of this pool. FCF is what actually funds shareholder returns and big strategic moves, not OCF. A business can report strong operating cash flow and still carry thin or negative free cash flow if it has to keep reinvesting just to stay competitive.
The OCF-to-FCF gap as a diagnostic signal about capital intensity
The space between OCF and FCF isn't an accounting quirk, it's a measurement of how capital-intensive a business is and how much effort it takes just to stay in place competitively.
A software company with strong OCF and almost no physical assets will show OCF and FCF sitting close together. A manufacturer, a telecom carrier, or an infrastructure-heavy business will show a much wider gap. Two companies can post identical operating cash flow and end up with wildly different free cash flow, purely because of how their business models are built.
That dynamic plays out at scale right now across the AI infrastructure buildout. The CapEx-to-OCF ratio for large cloud and infrastructure companies has climbed sharply since 2023 and is projected to reach extremely high levels by 2026. OCF-to-FCF conversion has gotten noticeably worse even at businesses that are profitable and generating plenty of cash. For B2B buyers evaluating cloud vendors, that matters directly: a vendor's financial health can look completely different depending on which metric gets pulled up on the screen.
None of this means negative FCF is automatically a warning sign. High-growth companies often invest aggressively on purpose, and they accept negative FCF in the near term because they expect it to pay off later. What that negative number demands is an explanation, tied to specific milestones for when the investment turns into a return, not a shrug and a promise that it'll work out.
Working capital and receivables drag on OCF before CapEx
OCF can get suppressed before CapEx is even part of the conversation, and in B2B, the usual culprit is slow accounts receivable collection.
The cash conversion cycle captures this directly: Days Sales Outstanding plus Days Inventory Outstanding minus Days Payable Outstanding. The longer DSO runs, the more cash sits trapped in unpaid invoices instead of being available for operations, even while the revenue side of the ledger looks perfectly healthy. US B2B suppliers continue to face real strain in cash flow planning from late payment risk, and ongoing worry about the broader economic outlook is keeping pressure on trade receivables. Better invoicing software alone doesn't fix a problem this structural.
The effects stack on top of each other. Late collections depress OCF, depressed OCF shrinks the numerator in the FCF calculation, and a business with a genuine AR collections problem ends up looking weaker on both metrics than its actual commercial performance deserves. A services business with a below-median FCF conversion ratio is often telling on itself: working capital is eating cash because collections are lagging. Fixing that through billing discipline and receivables follow-up improves cash efficiency without touching growth, which is more than can be said for cutting CapEx, a move that risks hollowing out the asset base to hit a number.
AR discipline connects straight through to the metrics boards and lenders actually watch. A persistent DSO problem doesn't stay quietly parked in the AR ledger: it lowers OCF, then FCF, and eventually affects how a lender scores the business's credit. Invoice Butler operates in that exact space, managing the grinding, operational work of chasing down outstanding invoices, working through supplier portals, clearing missing-document holdups, and pushing every receivable toward actual collection. That work attacks the working capital drag suppressing OCF before it has a chance to turn into a bigger strategic problem.
Choosing between OCF and FCF depending on the decision being made
OCF and FCF don't compete for the same job, they answer two questions in sequence. OCF tells a finance leader whether the operational engine is sound. FCF tells them whether that engine, once it has covered its own needs, throws off real surplus cash. Reach for the wrong one and the analysis ends up pointing in the wrong direction.
OCF is the right tool for checking whether daily operations generate enough cash to keep the business running without leaning on outside financing. It's also the metric to pull up when diagnosing working capital trends, rising DSO, a buildup of inventory, payables getting squeezed, any of the signals that show operational trouble before it ever reaches the income statement. Quarter over quarter, OCF is how a finance leader tracks operational efficiency and cash generation on its own terms, separate from whatever capital investment cycle the business happens to be in. If an executive is digging into spending and overhead trends, they use OCF to find where the operational engine is leaking cash.
FCF becomes the right tool when the question shifts to what the business can actually afford to do with its cash: fund growth, pay down debt, make an acquisition, issue a dividend. Every one of those gets funded out of free cash flow, not OCF, so presenting that picture to a board, outside investors, or lenders means leading with FCF, since they're evaluating financial flexibility and the business's capacity to create value over the long run.
Neither metric tells the whole story by itself. OCF can mask CapEx strain building underneath it, and FCF conversion can mask real operational weakness when the timing of cash flows happens to be favorable that quarter. Track both side by side and treat any divergence between them as a prompt to dig in.
FCF variants and the definitional confusion finance leaders need to navigate
Free cash flow isn't one single number. At least three standard variants exist, each built to answer a different valuation question, and plugging the wrong one into the wrong context produces an answer that looks precise and is actually misleading.
CFO-based FCF, calculated as OCF minus CapEx, is the shortcut most finance leaders reach for day to day. It comes straight off the cash flow statement and works well for operational monitoring and a quick read on business health. Unlevered free cash flow, or FCFF, calculated as EBIT times one minus the tax rate, plus D&A, minus CapEx, minus the change in working capital, serves a different purpose: it's used in enterprise valuation through a discounted cash flow model at the weighted average cost of capital, and it strips out financing effects entirely so the whole business can be valued independent of how it's funded. Levered free cash flow, or FCFE, calculated as net income plus D&A, minus CapEx, minus the change in working capital, plus net borrowing, is used for equity valuation and for judging how much room a company has for dividends or buybacks, since it reflects what's left for equity holders after debt obligations are paid.
The CFA Institute's 2026 refresher adds a sharper point on top of all this: net income, EBIT, EBITDA, and CFO should never be used as cash flow measures to value a firm, because each of these either double-counts or leaves out part of the actual cash flow picture. Valuation-grade FCF work calls for picking the right formula on purpose, not just grabbing whichever number happens to be closest at hand.
One objection from practitioners deserves a direct mention. The standard FCF formula makes no distinction between maintenance CapEx and growth CapEx. A company can quietly cut back on maintenance spending, watch its reported FCF climb as a result, and let its asset base degrade the entire time, all while the metric says things are improving. The number doesn't lie, but it also doesn't tell the whole story unless someone asks what kind of CapEx got cut to produce it.