Payment Terms Benchmarks by Industry and Business Size
Global payment delays cost companies $600 billion in trapped cash.
Payment terms tell you what a seller expects to get paid. DSO tells you what actually happened. The gap between those two numbers, industry by industry, is where the real story of cash flow lives, and most finance teams only look at half of it: the invoice, never the aftermath.
The global baseline: its current standing and reasons for movement
Global DSO hit 59 days in 2023, the biggest single-year jump since 2008. Nearly all 22 sectors tracked moved the same direction that year, and that's the part that should bother you more than the number itself. This wasn't one industry having a bad quarter. Money slowed down moving from invoice to bank account almost everywhere, all at once, which is a much stranger thing to see than a single sector stumbling.
A 2024 cross-industry read put the median closer to 56 days, a different sample and a different year doing what samples and years do to a number. Zoom out and the trend keeps bending the same way: by early 2025, global working capital reached 78 days, so businesses waited more than two and a half months, on average, to turn a sale into cash actually sitting in the bank. Domestic cash conversion cycles ran longer still, around 89 days.
At the large-company end, one major bank flagged $707 billion in trapped working capital across the S&P 1500 in 2024, with 67% of those companies posting a longer DSO than the year before, a widespread drift rather than a few outliers. That's not a handful of outliers dragging the average up. Most of the group drifted the wrong way at the same time, for the same reason: collections got slower, and nobody fixed it fast enough to matter.
A major consulting firm's 2025 domestic Working Capital Survey sharpens things further: an 18-day DSO gap between top-quartile performers and the median, across the top 1,000 nonfinancial public companies, worth something like $600 billion sitting in accounts that could be moving faster. A large national market. cash conversion cycle did improve 4% year over year, down to 37 days, so progress is clearly possible. It's just badly distributed, and the distance between median and good is enormous.
None of these headline figures mean much on their own, though. An 85-day DSO is a five-alarm fire in one industry and a perfectly boring Tuesday in another.
Reading an industry DSO benchmark without being misled by it
DSO only means something when structural facts produce it and stand next to it: transaction size, who the buyer is, how billing works, what actually triggers payment. Strip those away and you're comparing numbers for the sake of comparing numbers, a great way to alarm your CFO over nothing.
Take that 85-day figure again. For a high-value industrial manufacturer selling to commercial buyers on infrequent, large purchases, 85 days is unremarkable. For a clothing retailer, 85 days means collections broke down weeks ago and nobody noticed.
Three things push DSO up with no collections failure behind them at all. Progress billing tied to project milestones, common in construction and engineering, spreads payment across a timeline that has nothing to do with how fast the customer wants to pay. Payer intermediaries, insurers and government agencies especially, add processing time that has nothing to do with buyer intent (healthcare runs almost entirely on this model). And negotiated extended terms baked into large supply agreements, standard in wholesale and automotive, mean a long DSO was the deal from day one.
Compare your DSO to the sector median first, sure. But the comparison that actually tells you something is against the top-quartile performer in that same sector. The 18-day gap the Hackett Group found is where the recoverable cash sits.
Net 30 shows up in roughly 52% of commercial B2B contracts, Net 60 in about 28%, with Net 90 making up much of the remainder. Once that's the baseline, a customer proposing Net 90 out of nowhere isn't just unusual, it's a negotiation move dressed up as a default, and it should get treated as one.
Sector benchmarks: retail, food service, clothing, and transportation
Retail and food service is at the fast end: 10 to 30 days DSO. Cash and card transactions dominate, inventory turns quickly, and the business model assumes payment up front or close to it.
Clothing, accessories, and home goods post the lowest median DSO of any sector tracked. Inventory sitting on a shelf costs money every day it sits there, so the incentive to collect fast gets baked straight into the margins. No negotiation needed.
Transportation and logistics run 35 to 50 days, slower than retail but faster than manufacturing, shaped by a mix of standard and volume-based terms. Terms shift depending on relationship depth and volume, with the same carrier often quoting differently based on who's on the other end of the invoice.
For finance teams in these sectors, a DSO drifting past 50 days is a real warning light, and there's no structural cover to hide behind the way manufacturing or healthcare gets. If the number is creeping up here, delinquency drag appears in real time in that trend, and it says something about how the business runs its collections, not about the sector.
Sector benchmarks: SaaS and professional services
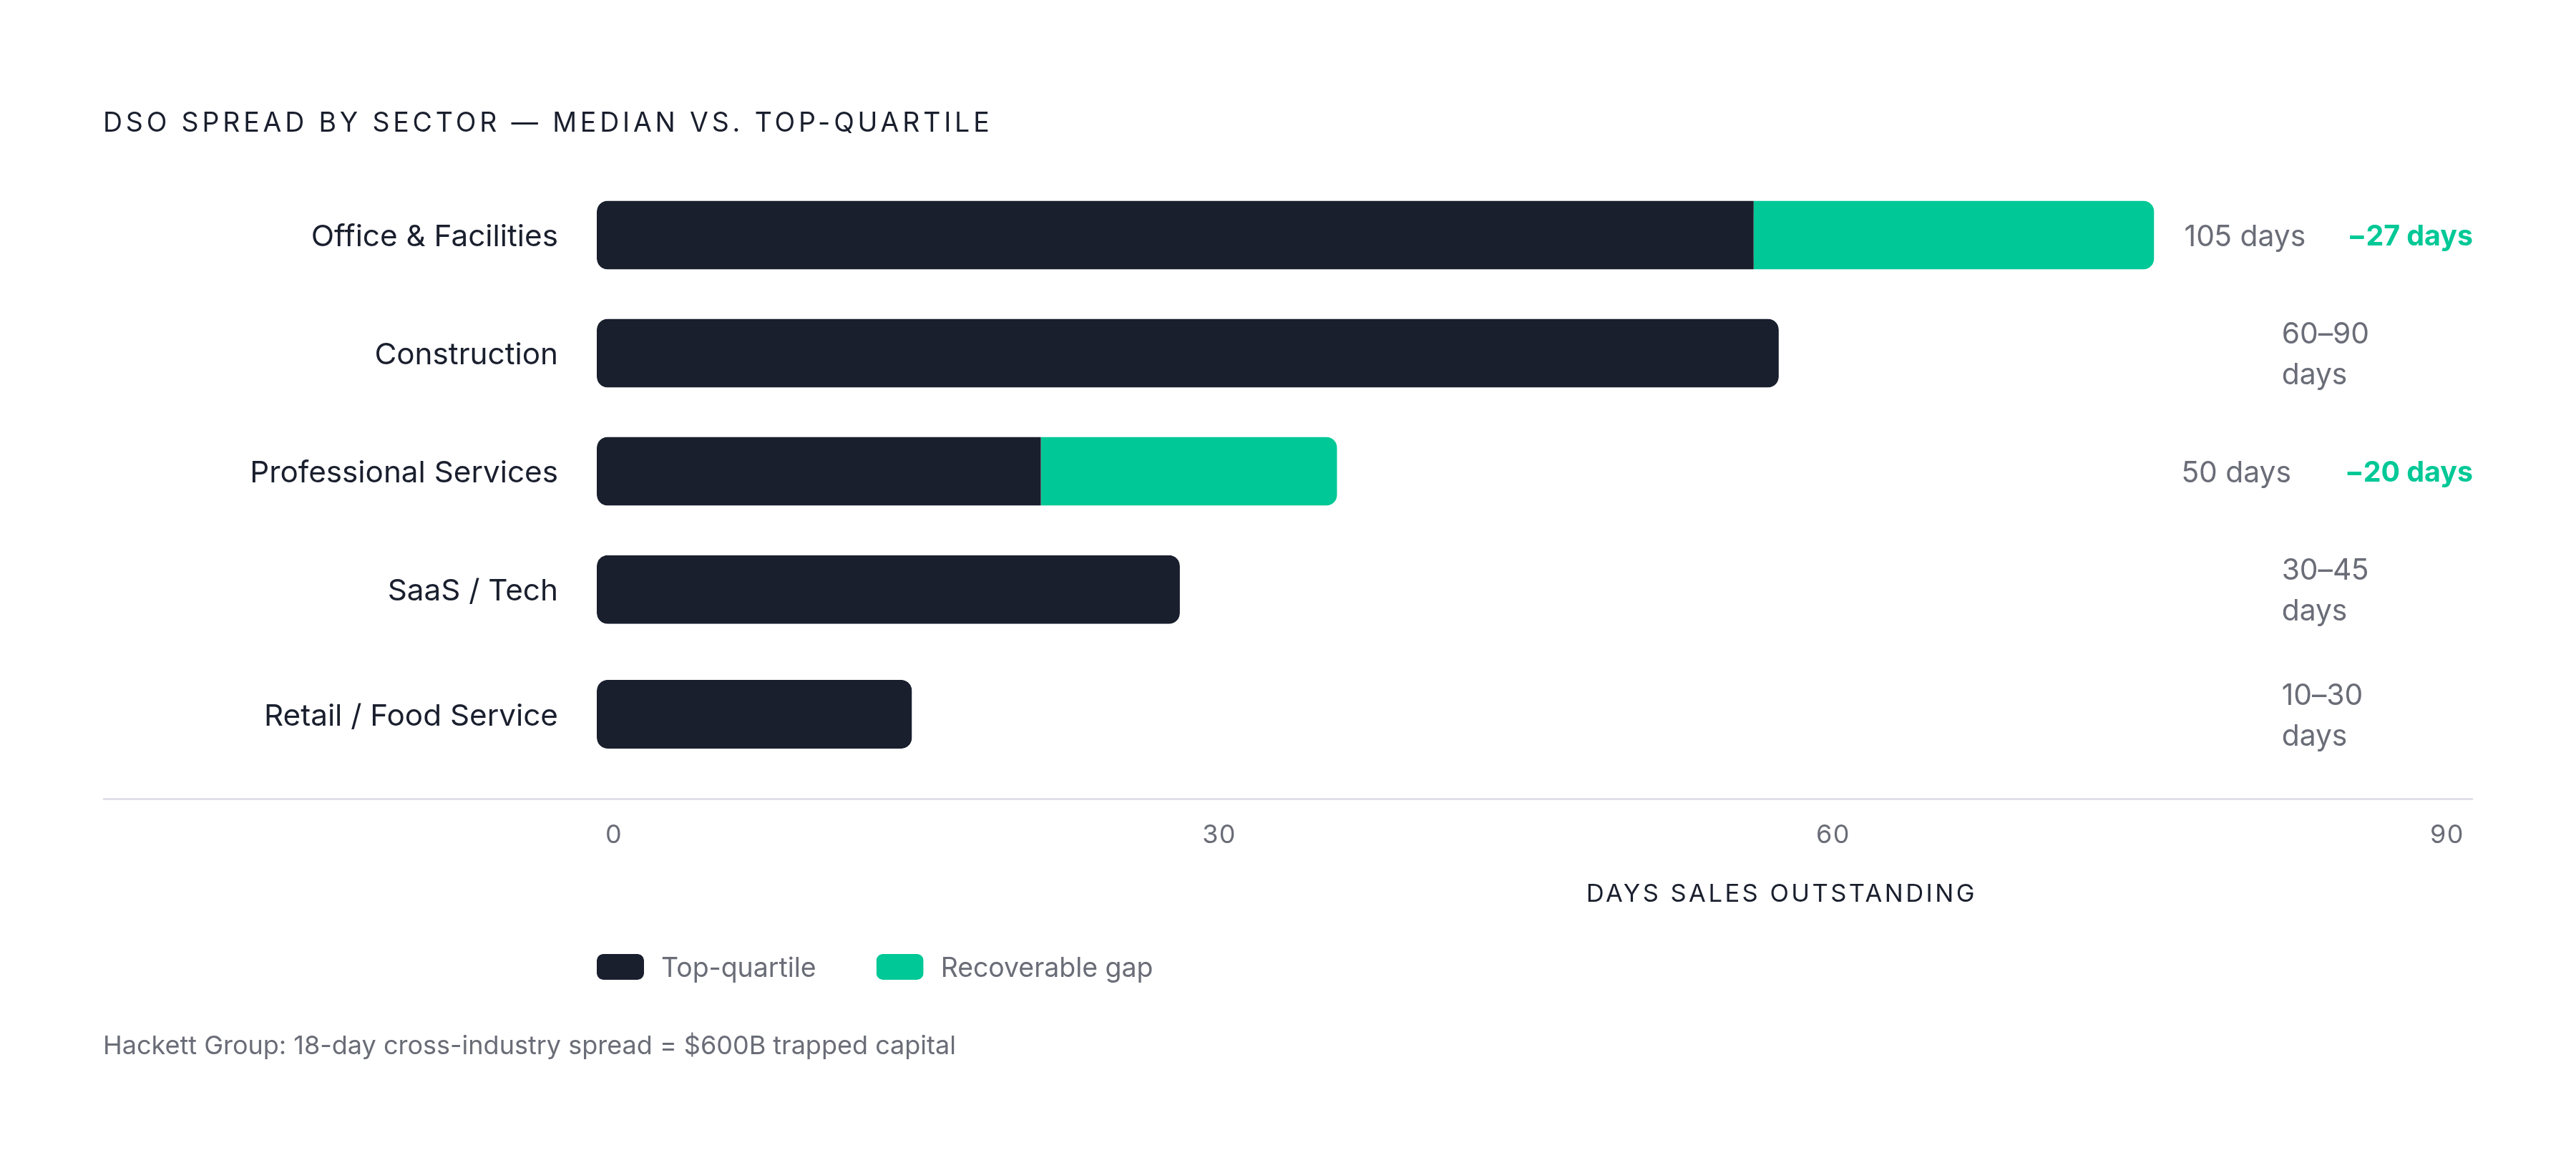
SaaS and tech companies run around 30 to 45 days DSO, driven by monthly recurring billing and enterprise contracts typically priced at Net 30-45. Annual prepayment deals, where a company can land them, cut DSO by 40 to 60%. Nobody's collecting a 12-month manufacturing contract up front, but plenty of SaaS vendors get customers to pay the whole year on day one and treat it as routine, not a favor.
Term tiering happens constantly here too: Net 15 for monthly plans, Net 30-60 for annual contracts, deposits up front for anything custom and large. It's less "one company, one policy" and more different terms for different risk levels, priced accordingly.
Professional services and consulting tell an uglier story. Median DSO runs above 50 days even though most firms quote Net 30 on paper, and that 20 to 35 day gap between the contract and the actual collection is the real signal, worth more attention than the raw DSO number by itself.
Office and facilities management is at the extreme: the longest average DSO of any sector tracked, at 105 days, against 78 days for top-quartile performers in that same sector. Twenty-seven days of daylight between median and best, doing the exact same kind of work. That gap is execution, plain and simple, not some structural quirk of the industry.
In services, Net 30 on paper routinely runs against actual collection timelines that exceed 50 days, and that gap means collections take far longer than the payment terms allow, sitting there in plain sight for anyone who bothers to check the math.
Sector benchmarks: manufacturing, wholesale, and construction
Manufacturing runs 45 to 60 days, driven by long production cycles, milestone-based invoicing, custom orders, and bigger transaction sizes. Wholesale distribution comes in lower, at 30 to 50 days, despite feeling adjacent to manufacturing on paper.
Tiered terms are just how manufacturing does business: Net 30 for standard accounts, Net 60 once a distributor clears a volume threshold, Net 90 negotiated into annual agreements with major retail partners. UK data from Good Business Pays' Spring 2024 research shows a 20% jump in companies reporting average payment times over 80 days. Manufacturers were prominently represented among companies averaging above 100 days, which tells you exactly where the pressure in that supply chain sits.
Wholesale and distribution run 40 to 55 days, and thin margins make even small DSO slippage expensive fast. A 10-day slip hits very differently at a 3% margin than at a 30% margin, and wholesale tends to live a lot closer to the former than most people assume.
Construction runs its own game: 60 to 90-plus days is normal, and final payment can stretch to 90-120 days once retainage (5 to 10% held back until project completion) and multi-tier approval chains get involved. High DSO here reflects the operating model, full stop, not a collections failure. What matters is whether the actual number falls inside that 60-90-plus day band. It's whether the actual number falls inside that 60-90-plus day band. UK construction, per Shuttleglobal's analysis, is the worst-performing sector overall, averaging 65 to 80 days DSO, driven by long supply chains, layers of subcontractors, and main contractors who stretch payment terms well past anything reasonable.
Sector benchmarks: healthcare, life sciences, and pharma
Healthcare and life sciences run 45 to 70 days, and the driver has almost nothing to do with the patient or the customer. It's the payer processing cycle doing what it always does. Insurance claims alone take 30 to 60 days to process. Add prior authorization requirements (another 10 to 20 days) and a denial rate that forces resubmission on 5 to 15% of claims, and the timeline stretches out even when the provider does everything right and on time.
Benchmarking a hospital's DSO against a manufacturer's is comparing two different games, and it wastes an afternoon that could go somewhere useful. The right peer group for a healthcare provider is other healthcare providers with a similar payer mix. Full stop, no exceptions.
Pharma has its own shape. Sixty-five percent of B2B sales in the sector happen on credit, part of a broader shift toward more open trade credit policies, with average terms around 45 days, according to Atradius's North America B2B Payment Practices report.
For healthcare finance teams, isolating the portion of DSO that's avoidable matters: wrong billing codes, missing documentation, portal errors nobody caught. That's the delinquency drag hiding inside a number that looks, on the surface, like it's just how healthcare works. It's fixable friction wearing a structural disguise.
How company size shapes the terms a business can set and enforce
Setting a term on an invoice and enforcing it are two different skills, and company size decides how much say a business gets in either one.
Roughly 80% of small businesses report challenges tied to customer payments, per the Federal Reserve's 2023 Small Business Credit Survey. Late payment is close to a universal problem for small operators, and the damage compounds quietly in the background. Research has put a number on it: the typical small business carries $78,355 in unpaid invoices at any given moment. Multiply that across the small business economy and the figure is around $304 billion in trapped working capital, sitting in limbo instead of funding payroll or inventory.
Startups get hit twice. With no payment history, suppliers extend less credit, often starting new accounts at Net 15 or Net 30 where an established buyer might land Net 60. Payment history works like a credit score here. It takes time to build, and there's no shortcut around it, no matter how good the product is.
Small and mid-sized businesses often show more flexibility on terms than large enterprises do, which surprises people who assume size always wins. The structure explains it: direct relationships with customers, fewer people needed to sign off on a change, versus the multi-layer approval chains that slow everything down at a big company.
Large enterprise buyers, meanwhile, routinely push for Net 90 or longer, especially in government contracts and high-volume supply deals. A manufacturer supplying a major automaker on Net 90 might be operating entirely within sector norms. A small services firm agreeing to that same Net 90, with one client covering a big chunk of its revenue, is playing a far riskier game with the identical term on paper. Same number, wildly different exposure, and only one of those two companies can actually survive the wait.
Reading the gap between your terms and your DSO as an operational signal
The Billtrust 2026 AR Benchmark Report, built on 2025 performance data across thousands of organizations, offers a useful ceiling: average DSO of 39 days, down 6 days year over year, with average days delinquent at 6 days. It won't fit every business, but it's solid evidence of what's achievable when AR operations run tight instead of loose.
Two questions turn a benchmark from trivia into an actual diagnostic. First: is DSO above or below the sector median, and if it's above, is the gap structural (billing model, payer type) or operational (slow follow-up, portal friction, paperwork sitting untouched)? Second: what's the spread between the contracted term and the actual DSO? A 20 to 35 day gap is business as usual in professional services, but that same gap on Net 30 in SaaS points straight at a collections process leaking days somewhere nobody's watching. Whether a company is at top quartile versus median determines how much of that 18-day spread by The Hackett Group it can convert into cash sitting on the table, waiting for someone to go pick it up. The Hackett Group's 18-day spread between those two bands is cash sitting on the table, waiting for someone to go pick it up.
Delinquency drag often has nothing to do with whether the customer intends to pay. A missing tax form, an invoice buried three clicks deep in a supplier portal, a status email nobody answers, an escalation path that's supposed to trigger and just doesn't: none of that is a customer refusing to pay. It's friction, and friction adds days just as effectively as bad intent does, maybe more, because nobody tracks it as a problem the way they'd track a deadbeat account.
Billtrust's data also shows average days delinquent rising 1 day year over year even while overall DSO improved, a reminder that these two metrics don't always move together. A company can get faster on average while its worst accounts get slower and drag the tail further out. Finance teams checking DSO once a quarter tend to find out about that slippage after it's already dented the cash position, not before.
Using benchmarks to negotiate better terms with customers and suppliers
A benchmark turns a negotiation from opinion into evidence. "Our sector median is 45 days, and Net 90 is an outlier" lands very differently in a vendor conversation than "we'd prefer faster payment," because one is a preference and the other is a fact sitting on the table that's hard to argue with.
Pushing customer terms shorter has a few reliable levers. Early payment discounts work when the discount rate makes the annualized cost of capital cheaper than what the seller would otherwise pay to borrow, and they land hardest in manufacturing and wholesale, where buyers actively manage their own DPO. SaaS companies get a similar result through annual prepayment framing instead of discounting outright, which drops DSO without setting a discount precedent that customers then expect forever. In pharma, where 65% of sales already run on credit, tightening credit policy for new accounts is a credible, fairly ordinary lever that most buyers recognize on sight.
On the supplier side, extending terms has just as much room to move. With Net 30 at roughly 52% of commercial contracts, asking for Net 45 or Net 60 is a reasonable opening position for a buyer with a track record of paying on time. Volume tiering, standard Net 30 that steps up to Net 60 once an order clears a threshold like $50,000, is a documented, widely recognized practice in manufacturing and wholesale. Suppliers see it often enough that it reads as normal business, not a red flag.
None of this replaces the unglamorous work of actually collecting: chasing down documents, navigating supplier portals, following up on invoices that fell through the cracks. But AR teams that handle those operational blockers consistently claw back days from the delinquency drag, no negotiation required. Just better plumbing.