Measuring ROI on AR Automation Investment
Vendor ROI claims are ceilings, not floors—here's how to build a realistic business case.
There's a 384% ROI figure floating around AR automation circles right now. It comes from vendor-commissioned research, it's real, and it is almost certainly not what your company will see in Year 1. That doesn't mean it's wrong. It means it's a ceiling, not a floor — and if you're building a business case for AR automation, the difference between the ceiling and your actual number is what this piece is about.
Think of it like a weather forecast: the vendor's number is the record high for the region, not the temperature you should dress for.
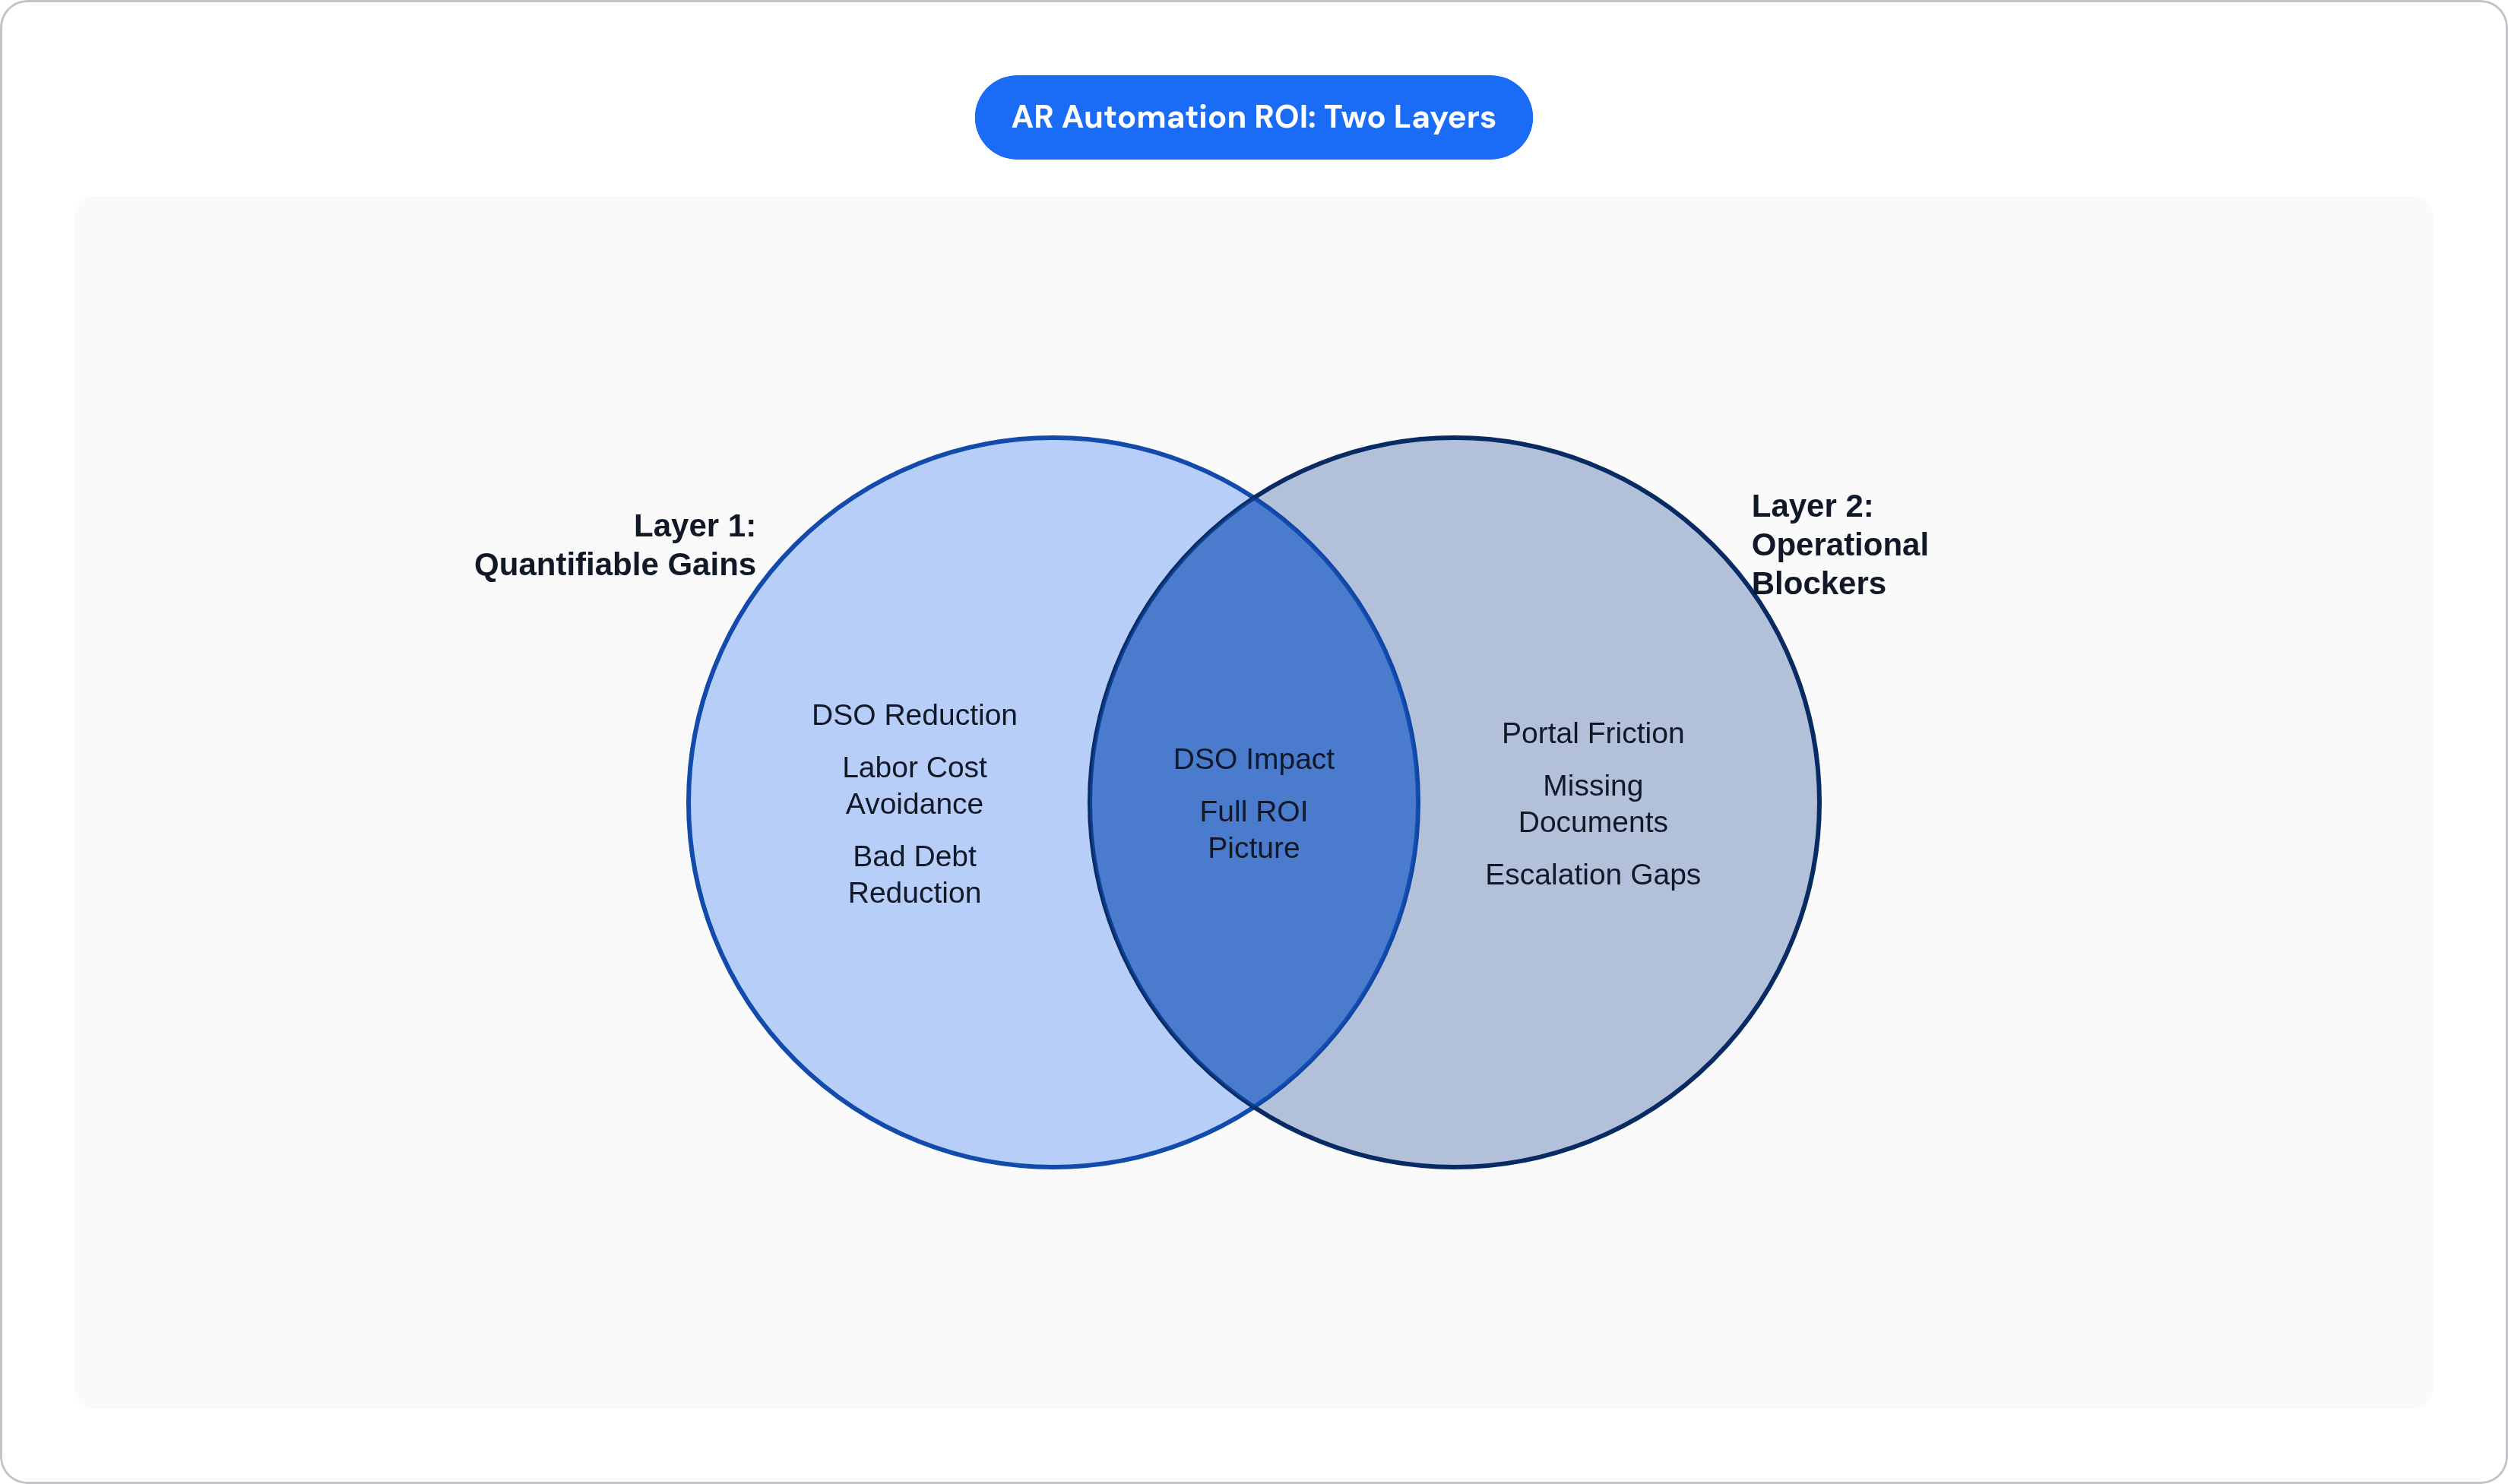
The complete ROI picture has two layers. The first is the quantifiable gains: DSO reduction, labor hours recovered, invoice processing cost, bad debt reduction. Most ROI frameworks stop there. The second layer is the operational drag that survives automation. Portal friction. Missing documents. Failed follow-ups that fall back to staff. These don't show up on the vendor calculator, but they show up on your DSO report. Ignoring them doesn't make them go away. It just makes your automation look worse than it should.
Here's a framework you can actually use.
The Market Backdrop That Explains Why Expectations Are Running High
The AR automation market is not a niche anymore. Analysts peg it at several billion dollars in 2025, with projections reaching into the tens of billions by the early 2030s, depending on how broadly the researcher defines the category. The range reflects scope differences, not noise. Either way, the growth trajectory is steep and consistent across sources.
Large enterprises currently dominate spending. But small and mid-sized businesses are growing faster as a segment, which matters for ROI measurement because the baseline these companies start from is dramatically more manual. Higher starting point means higher potential return. It also means more room to plateau early if the deployment doesn't cover the full cycle.
The urgency behind all of this spending is real. Nearly 90% of businesses report that roughly 30% of their invoices are paid late. For companies with extended payment cycles, that translates to an average loss of about 4.6% of revenue tied up in payment uncertainty. On a $25 million business, that's north of $1 million sitting in limbo.
Here's the thing about that urgency: it creates buying pressure, and buying pressure creates inflated expectations. A company automating because "everyone is doing it" needs different ROI anchors than one automating because its DSO is 65 days and climbing. The framework matters. The baseline matters more.
DSO Reduction: The Primary ROI Driver and How to Size It Honestly
DSO is the headline metric because it converts directly to cash. Each day you shave off DSO releases working capital proportional to your daily revenue. On $50 million in revenue, a 10-day DSO reduction frees roughly $1.37 million. On $100 million, roughly $2.74 million. That math is simple and defensible, which is why it leads every vendor conversation.
The baseline context is important here. Median DSO across industries sat at 36.70 days as of Q2 2025. US B2B typically runs 45 to 65 days, with manufacturing and consumer goods often pushing past 70. Most companies have meaningful room to move.
What does automation actually deliver on DSO? A 2025 study of 500 finance leaders found that high-automation organizations averaged a 41% DSO reduction. Even low-automation adopters saw a 29% improvement. Industry benchmarks generally cluster around a 20% to 40% reduction within two quarters of deploying automated dunning and payment matching. Real-world cases back that range. One company achieved a 33% DSO reduction alongside a 22% drop in past-due invoices and a 20% reduction in overdue dollars.
To size this for your business:
- Take your daily revenue (annual revenue divided by 365)
- Multiply by the number of DSO days you expect to recover
- Apply your cost of capital to get the working capital value, not just the accounting figure
The honest caveat: DSO gains depend almost entirely on how much of the invoice-to-cash cycle is actually automated. Partial deployments produce partial results. A company that automates dunning but still handles portal submissions and document requests manually will see a fraction of the headline reduction.
There's also something DSO math doesn't capture at all. Some invoices are slow not because customers are slow payers but because something is stuck. Wrong contact. Missing tax form. Portal rejection. Those invoices will not respond to automated dunning sequences. They just sit there, inflating your DSO number and making the automation look less effective than it actually is. We'll come back to that.
Labor Cost Avoidance: What the Headcount Math Actually Looks Like
AR teams spend the majority of their day on tasks that don't require human judgment. Cash application. Remittance matching. Dispute research. Chasing down the same invoice for the third time this month. These are important tasks. They're just not tasks that need a person.
Automation removes the manual work that consumes the majority of AR staff time, according to research from Ardent Partners. What remains after automation — relationship management, complex disputes, credit decisions — is where human judgment is actually valuable. The Hackett Group's 2024 AR performance benchmarks found that top-quartile automation adopters operate with 40% fewer AR FTEs per billion in revenue than bottom-quartile peers. After automation, AR teams report that a substantial share of their time can shift from manual administration to more strategic work.
Building the estimate:
- A fully loaded AR specialist runs roughly $60,000 to $90,000 per year including salary, benefits, and overhead
- A mid-sized B2B company with two AR employees, automating a substantial share of manual work, generates meaningful annual labor savings before DSO and bad debt gains are added
- That's not a dramatic number in isolation. Stack it on top of the DSO and processing cost savings, and it becomes significant
One thing to be honest about in the model: labor savings rarely mean headcount reductions in practice. They mean capacity redeployment. The more accurate way to measure this is hours recovered multiplied by loaded hourly cost. Not headcount eliminated. Your finance team probably won't cut a head over AR automation. But they will stop needing to hire the next one, and they'll get better work out of the people they have.
The limit of this math: it assumes the automation handles follow-up reliably. When a customer requires portal navigation or has a document pending or needs an exception handled, a workflow rule can't resolve it. That follow-up still lands on a person.
Invoice Processing Cost and Bad Debt Reduction: The Compounding Gains Beneath the Headline
These two line items don't get the airtime DSO does, but they're often easier to defend internally because the math is less assumption-dependent.
Invoice Processing Cost
Manual invoice processing averages tens of dollars per invoice. Automation brings that figure to just a few dollars. That's a structural cost advantage that compounds across every invoice in the cycle. For high-volume AR operations, this is often the cleanest ROI line item to put in front of a CFO. No assumptions about customer behavior. No dependency on DSO projections. Just unit economics.
Bad Debt Reduction
Most businesses write off a meaningful share of AR as bad debt annually. Automation reduces that meaningfully by shortening collection cycles and catching delinquent accounts earlier. The same DSO reductions cited above (29% to 40%+) correspond to meaningful bad debt improvements. Manual operations typically write off a higher share of revenue. Automated operations can bring that to the low end of the range. On $25 million in revenue, the difference between the high and low end of that range is hundreds of thousands of dollars.
The Hackett Group's 2024 Customer-to-Cash Receivables Software report found automation can deliver up to $7 million in combined benefits for mid-sized firms when DSO, labor, processing cost, and bad debt are measured together. That's the full picture.
How to add these to the model: use conservative assumptions. For bad debt, try halving the current write-off rate applied to your current AR balance. Avoid vendor-cited maximums unless you can point to a comparable company with comparable starting conditions.
What all four of these buckets share: they measure what happens when automation works as intended. They don't measure what happens when it hits its ceiling.
The Operational Blockers That Quietly Erode Returns After Automation Goes Live
This is the part most ROI frameworks skip. It's also the part that explains why so many companies deploy AR automation, see an initial DSO improvement, and then plateau.
The remaining slow invoices are slow for reasons the automation wasn't built to handle.
Supplier Portal Friction
A large and growing share of B2B invoicing flows through procurement portals like Coupa and Ariba. Each one has its own submission rules, approval workflows, and error codes. Automation that sends invoices to email or triggers dunning sequences doesn't navigate portal rejections, resubmissions, or status check loops. Those fall back to staff.
The ROI implication is subtle but important. Portal-related delays don't show up as automation failures. They show up as persistent DSO drag on a subset of accounts. The automation looks less effective than it is, because the measurement doesn't distinguish between accounts where automation is working and accounts where a portal is blocking payment regardless of the automation.
Missing Documents
W-9s. Purchase order numbers. Tax exemption certificates. Proof-of-delivery documentation. These routinely block payment not because customers are unwilling to pay but because the invoice can't be processed without them. Automated dunning sequences triggered by days-past-due don't know the difference between a delinquent customer and a customer waiting on a document they requested two weeks ago. The follow-up lands wrong. It damages the relationship. It doesn't resolve the blocker.
Failed or Mistimed Follow-Up
Rule-based automation applies the same sequence to every invoice. Some customers respond to a personal call. They will not respond to a third templated email. The invoice sits. The collection cycle extends. The working capital math from Layer 1 never fully materializes.
Escalation Gaps
Automation handles routine cases well. When an invoice hits a dispute, a credit hold, or an internal approval chain, a system that can't escalate appropriately either lets the invoice stall or escalates everything and creates noise. Real problems get lost in the volume.
How to quantify this in the model: segment your AR ledger by reason for delay. Disputed. Portal-blocked. Document-pending. Non-responsive. Calculate the DSO contribution of each category. The share that automation alone can't resolve is the gap your ROI model needs to account for.
Building a Complete ROI Model: The Inputs, the Math, and the Assumptions to Stress-Test
Five inputs every AR automation ROI model needs:
- Current DSO and revenue. This sizes your working capital release per day reduced.
- Current AR headcount and loaded cost. This estimates labor capacity recovered.
- Invoice volume and current processing cost per invoice. This models per-unit savings.
- Current bad debt write-off rate as a percentage of AR. This estimates reduction value.
- Invoice delay segmentation by root cause. This separates automation-addressable delays from operational blockers that require additional intervention.
The assumptions that move the number most:
- Deployment speed. ROI in Year 1 depends almost entirely on how quickly the automation covers the full invoice-to-cash cycle. Partial deployments compress returns into Year 2 and beyond.
- Starting state. Companies with highly manual processes see higher returns in Year 1. Those with partial automation already in place typically see lower first-year returns. The lower ceiling isn't a failure. It's a sign that some gains have already been captured.
- Portal and blocker coverage. If the solution doesn't address the operational friction identified in the segmentation step, the DSO projection is overstated. Discount working capital gains accordingly for the share of invoices stuck behind blockers the automation can't resolve.
Payback period benchmarks: the vendor-commissioned IDC research found a 9-month average payback period for their customer set. Independent benchmarks generally support payback within the first year for mid-sized businesses with manual-heavy AR, as long as the automation covers the full cycle. "Full cycle" is doing a lot of work in that sentence. Make sure you know what it means for your specific deployment.
The APQC and Hackett Group benchmarks are useful as sanity checks, not promises. Top-performing AR organizations achieve meaningfully lower costs per unit of revenue and significantly lower overall finance costs than typical peers. Use those as a target state to orient the model, not as the number you'll hit in quarter one.
What to do with the gap: the portion of DSO that operational blockers explain is not a failure of the ROI model. It's a signal. It tells you that the automation solution needs to be paired with something that handles the exceptions the workflow can't.
What to Look for in an AR Automation Solution When the Full ROI Picture Is the Standard
The core evaluation question is simple: does the solution address only the routine collection cycle, or does it handle the operational blockers that keep DSO elevated after standard automation is live?
Layer 1 capabilities are table stakes at this point in the market:
- Automated dunning and payment reminders across configurable sequences
- Cash application with high straight-through processing rates
- Real-time AR aging and DSO dashboards
- ERP and accounting system integration
These are the capabilities every credible vendor offers. If a solution doesn't have them, the conversation is short.
Layer 2 capabilities are where the differentiation actually lives:
- Supplier portal navigation. The ability to submit, track, and resubmit invoices inside Coupa, Ariba, and similar procurement systems without manual intervention. This is the blocker that quietly inflates DSO on enterprise accounts and rarely gets addressed by standard automation.
- Document management. Proactive identification and resolution of missing W-9s, PO numbers, and supporting documentation before they stall payment. Not reactive. Proactive.
- Context-aware follow-up. Communication that adapts to the reason an invoice is delayed, not just how long it's been delayed. A dunning sequence that treats a portal-blocked invoice the same as a non-responsive customer is going to do damage.
- Escalation logic. Clear paths for disputes, credit holds, and exceptions that route to the right person without creating noise around everything else.
One solution worth evaluating in this context is Billtrust. It covers the Layer 1 fundamentals and its network-based approach gives it meaningful reach into the portal and payment infrastructure that most mid-market AR teams encounter. It's not the only option, but when you're evaluating on the full ROI picture rather than just the dunning sequence, it belongs in the conversation.
The honest version of the evaluation: no solution resolves every Layer 2 blocker out of the box. The right question isn't which vendor claims to solve everything. It's which vendor is transparent about what their automation handles and what still requires a person, and whether their workflow for the human-required exceptions is designed well or just an afterthought.
That distinction is the difference between an ROI model that holds up at 12 months and one that looked great in the pitch deck.